Chapter 2. Fundamentals
Performance tuning requires an examination and modification of the application as a whole.Therefore, effective performance tuning requires a wide range of knowledge, from hardware to 3D rendering to Unity mechanics.This chapter therefore summarizes the basic knowledge required to perform performance tuning.
2.1. Hardware
Computer hardware consists of five main devices: input devices, output devices, storage devices, computing devices, and control devices.These are called the five major devices of a computer.This section summarizes the basic knowledge of these hardware devices that are important for performance tuning.
2.1.1. SoC
A computer is composed of various devices. Typical devices include CPUs for control and computation, GPUs for graphics computation, and DSPs for processing audio and video digital data.In most desktop PCs and other devices, these are independent as separate integrated circuits, which are combined to form the computer.In smartphones, on the other hand, these devices are implemented on a single chip to reduce size and power consumption.This is called a system-on-a-chip, or SoC.

Figure 2.1: SoC
2.1.2. iPhone, Android and SoC
The SoC used in a smartphone differs depending on the model.
For example, the iPhone uses a SoC called the A series designed by Apple.This series is named by combining the letter "A" and a number, such as A15, with the number getting larger as the version is upgraded.
In contrast, many Android devices use a SoC called Snapdragon.This SoC is manufactured by a company called Qualcomm and is named something like Snapdragon 8 Gen 1 or Snapdragon 888.
Also, while iPhones are manufactured by Apple, Android is manufactured by a variety of manufacturers.For this reason, Android has a variety of SoCs besides Snapdragon, as shown below Table 2.1.This is why Android is prone to model-dependent defects.
Table 2.1: Major SoCs in Android
| Series Name | Manufacturer | Trends in devices equipped with |
|---|---|---|
| Snapdragon | Qualcomm Inc. | Used in a wide range of devices |
| Helio | MediaTek | Used in some low-priced handsets |
| Kirin | HiSilicon | Huawei devices |
| Exynos | Samsung | Terminals by Samsung |
When tuning performance, it is important to understand what is used in the device's SoC and what specifications it has.
The naming of Snapdragon has been a combination of the string "Snapdragon" and a three-digit number.
These numbers have a meaning: the 800s are the flagship models and are used in so-called high-end devices.The lower the number, the lower the performance and price, and the 400s are the so-called low-end handsets.
Even if a device is in the 400s, the performance improves with the newer release date, so it is difficult to make a general statement, but basically, the higher the number, the higher the performance.
Furthermore, it was announced in 2021 that the naming convention will be changed to something like Snapdragon 8 Gen 1 in the future, as this naming convention will soon run out of numbers.
These naming conventions are useful to keep in mind when tuning performance, as they can be used as an indicator to determine the performance of a device.
2.1.3. CPU
CPU (Central Processing Unit) The CPU is the brain of the computer and is responsible not only for executing programs, but also for interfacing with the various hardware components of the computer.When actually tuning performance, it is useful to know what kind of processing is performed in the CPU and what kind of characteristics it has, so we will explain it from a performance perspective here.
CPU Basics
What determines the execution speed of a program is not only simple arithmetic power, but also how fast it can execute the steps of a complex program.For example, there are four arithmetic operations in a program, but there are also branching operations.For the CPU, it does not know which instruction will be called next until it executes the program.Therefore, the hardware of the CPU is designed to be able to process a variety of instructions in rapid succession.
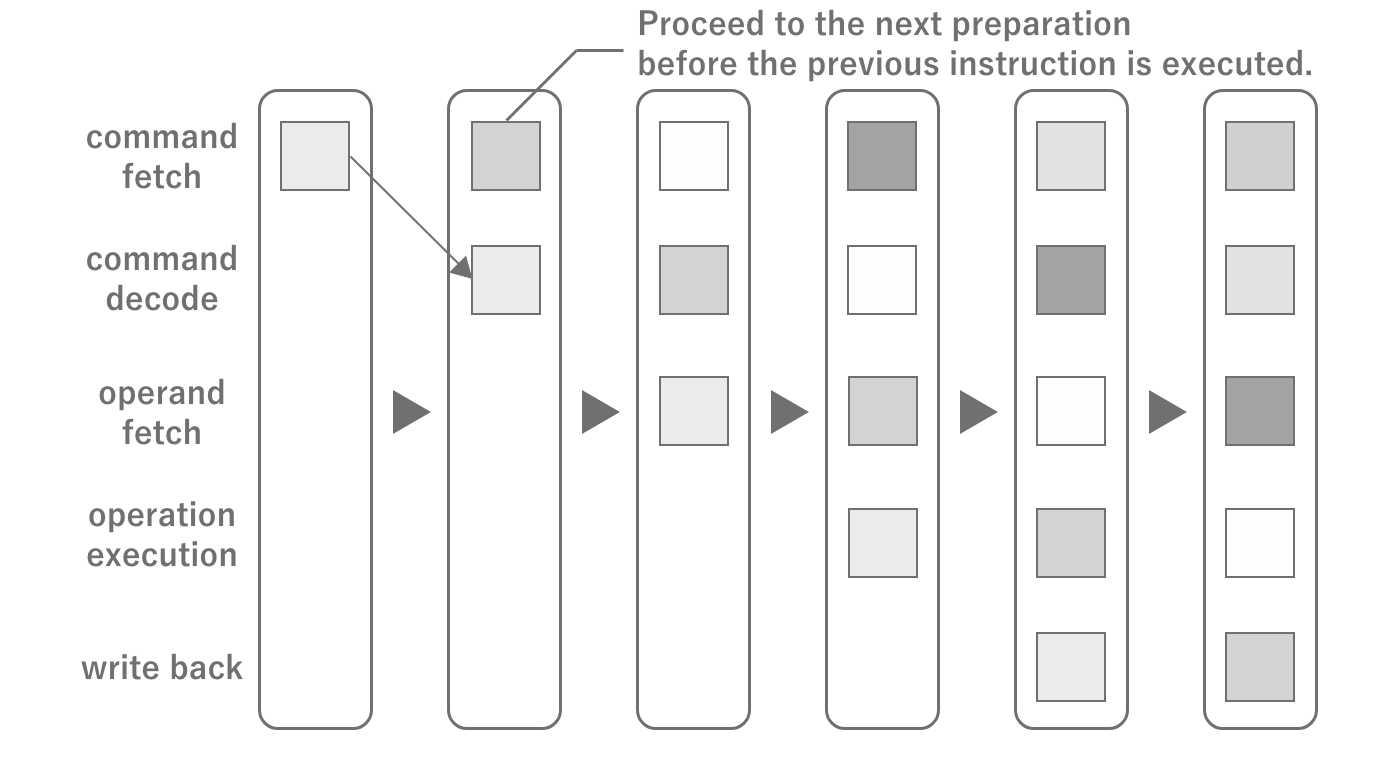
Figure 2.2: CPU Pipeline Architecture
The flow of instructions inside the CPU is called a pipeline, and instructions are processed while predicting the next instruction in the pipeline.If the next instruction is not predicted, a pause called a pipeline stall occurs and the pipeline is reset.The majority of stalls are caused by branching. Although the branch itself anticipates the result to some extent, mistakes can still be made.Although performance tuning is possible without memorizing the internal structure,just knowing these things will help you to be more aware of how to avoid branching in loops when writing code.
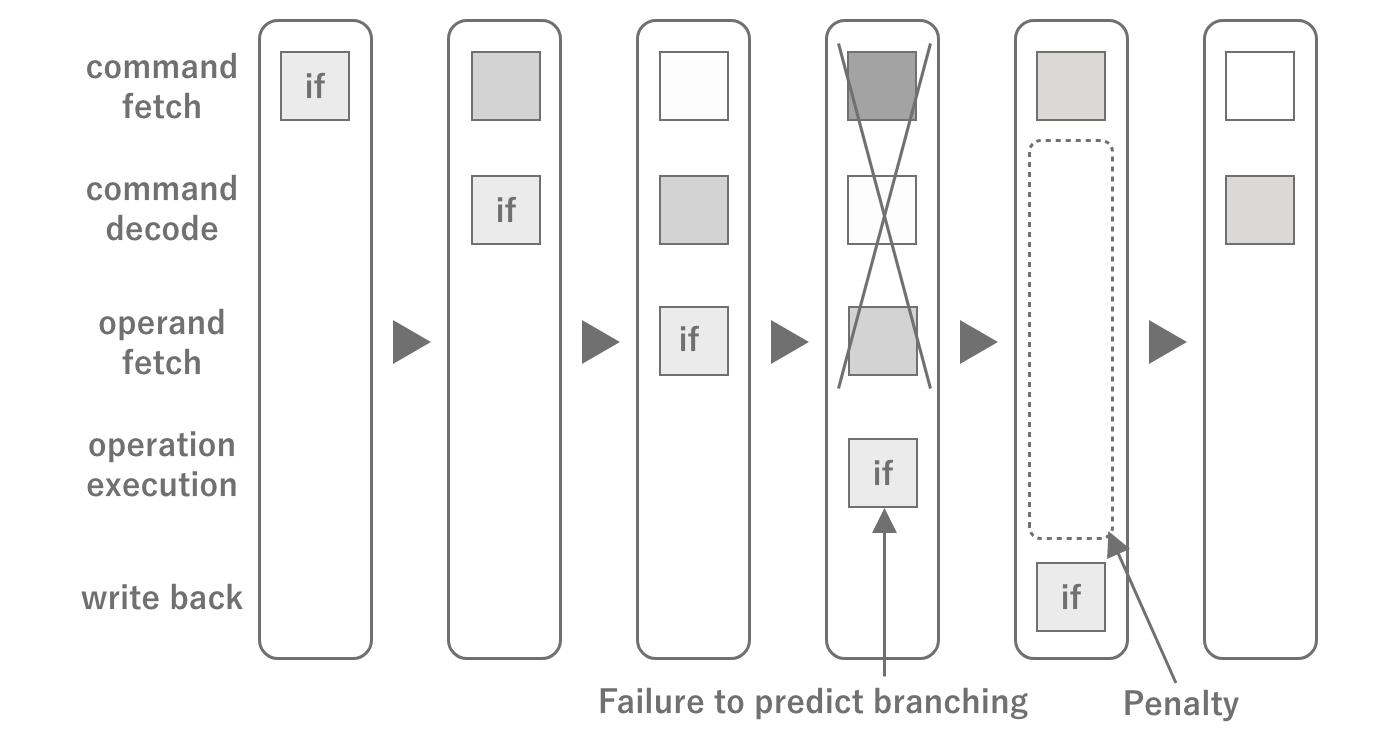
Figure 2.3: CPU Pipeline Stalling
CPU computing power
The computing power of a CPU is determined by the clock frequency (unit: Hz) and the number of cores. The clock frequency indicates how many times per second the CPU can run.Therefore, the higher the clock frequency, the faster the program execution speed.
The number of cores, on the other hand, contributes to the parallel computing power of the CPU. A core is the basic unit in which a CPU operates, and when there is more than one it is called a multicore.Originally, there were only single cores, but in the case of single cores, in order to run multiple programs, the programs to be run alternately are switched.This is called a context switch, and its cost is very high.If you are used to smartphones, you may think that there is always one application (process) running, but in reality there are many different processes running in parallel, including the OS.Therefore, in order to provide optimal processing power even under such circumstances, multi-cores with multiple cores have become the mainstream.As of 2022, the mainstream for smartphones is around 2-8 cores.
In recent years, CPUs with asymmetric cores (big.LITTLE) have become the mainstream for multi-core processors (especially for smartphones).Asymmetric cores refer to CPUs that have a high-performance core and a power-saving core together.The advantage of asymmetric cores is that normally only the power-saving cores are used to conserve battery power, and the cores can be switched when performance is required, such as in games.Note, however, that the maximum parallel performance is reduced by the power-saving cores, so the number of cores alone cannot be used to judge the performance of asymmetric cores.
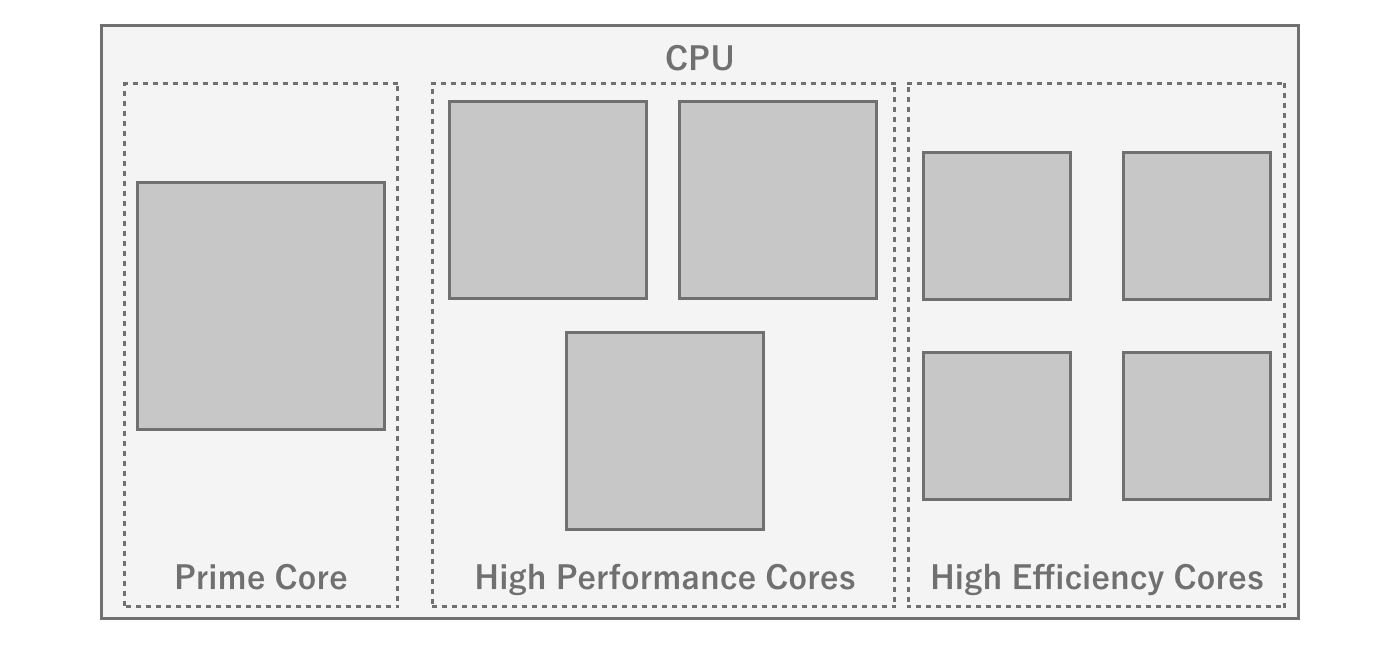
Figure 2.4: Heterogeneous core configuration of Snapdragon 8 gen 1
Whether a program can use up multiple cores also depends on the parallel processing description of the program.For example, there are cases where the game engine has streamlined the physics engine by running it in a separate thread, or parallel processing is utilized through Unity's JobSystem, etc.Since the operation of the game's main loop itself cannot be parallelized, the higher performance of the core itself is advantageous even with multiple cores. Therefore, it is advantageous to have a high performance core itself, even if it is multi-core.
CPU Cache Memory
The CPU and main memory are physically located far apart and require a fraction of the time (latency) to access.Therefore, this distance becomes a major performance bottleneck when trying to access data stored in main memory during program execution.To solve this latency problem, a cache memory is installed inside the CPU.Cache memory mainly stores a portion of the data stored in main memory so that programs can quickly access the data they need.There are three types of cache memory: L1, L2, and L3 cache. The smaller the number, the faster the speed, but the smaller the capacity.The smaller the number, the faster the cache, but the smaller the capacity.Therefore, the CPU cache cannot store all data, but only the most recently handled data.
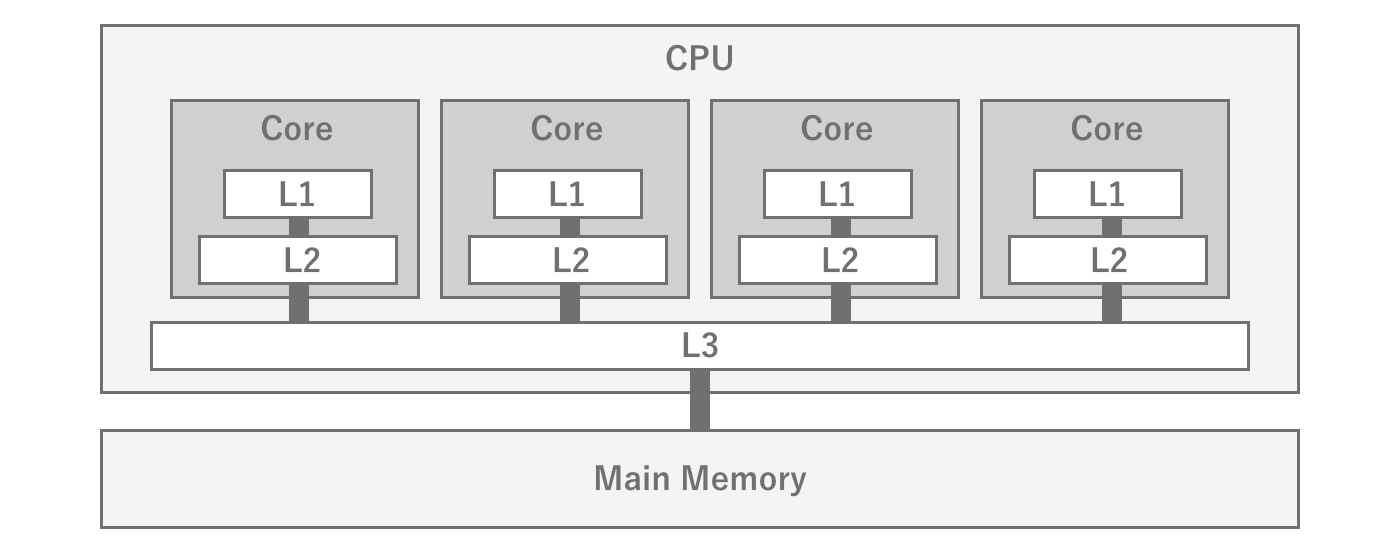
Figure 2.5: Relationship between the CPU L1, L2, and L3 caches and main memory
Therefore, the key to improving program performance is how to efficiently place data in the cache.Since the cache cannot be freely controlled by the program, data locality is important.In game engines, it is difficult to manage memory with an awareness of data locality, but some mechanisms, such asUnity's JobSystem, can achieve memory placement with enhanced data locality.
2.1.4. GPU
While CPUs specialize in executing programs GPU (Graphics Processing Unit) is a hardware specialized for image processing and graphics rendering.
GPU Basics
GPUs are designed to specialize in graphics processing, so their structure is very different from that of CPUs, and they are designed to process a large number of simple calculations in parallel.For example, if an image is to be converted to black and white, the CPU must read the RGB values of certain coordinates from memory, convert them to grayscale, and return them to memory, pixel by pixel.Since such a process does not involve any branching and the calculation of each pixel does not depend on the results of other pixels, it is easy to perform the calculations for each pixel in parallel.
Therefore, GPUs can perform parallel processing that applies the same operation to a large amount of data at high speed, and as a result, graphics processing can be performed at high speed.In particular, graphics processing requires a large number of floating-point operations, and GPUs are particularly good at floating-point operations.For this reason, a performance index called FLOPS, which measures the number of floating-point operations per second, is generally used.Since it is difficult to understand the performance only in terms of computing power, an indicator called fill rate, which indicates how many pixels can be drawn per second, is also used.
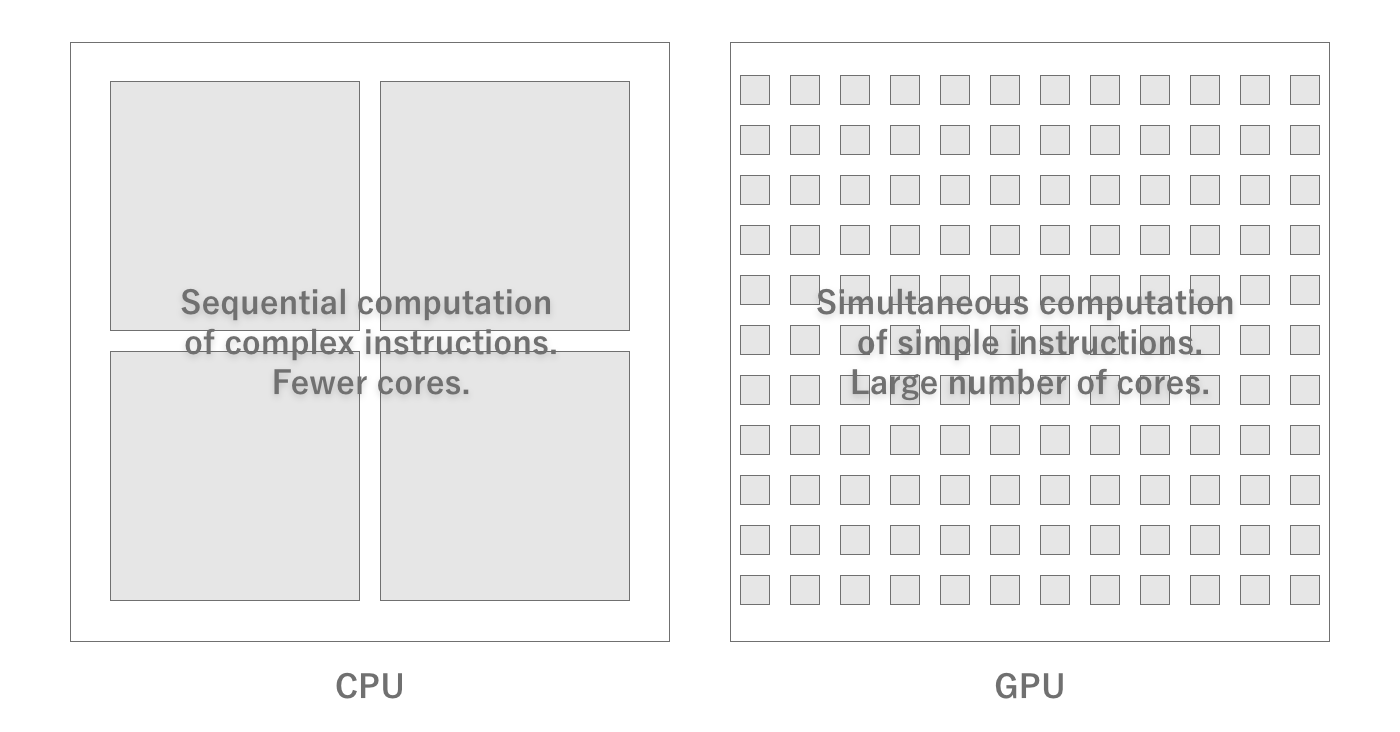
Figure 2.6: Difference between CPU and GPU
GPU Arithmetic Capacity
GPU hardware is characterized by a large number of cores (tens to thousands) that contain integer and floating-point arithmetic units.In order to deploy a large number of cores, the units required to run complex programs that were necessary for CPUs have been eliminated because they are no longer needed.Also, as with CPUs, the higher the clock frequency at which they operate, the more operations can be performed per second.
GPU Memory
GPUs, of course, also require memory space for temporary storage to process data.Normally, this area is dedicated to the GPU, unlike main memory.Therefore, to perform any kind of processing, data must be transferred from main memory to GPU memory.After processing, the data is returned to main memory in the reverse order.Note that if the amount of data to be transferred is large, for example, transferring multiple high-resolution textures, the transfer takes time and becomes a processing bottleneck.
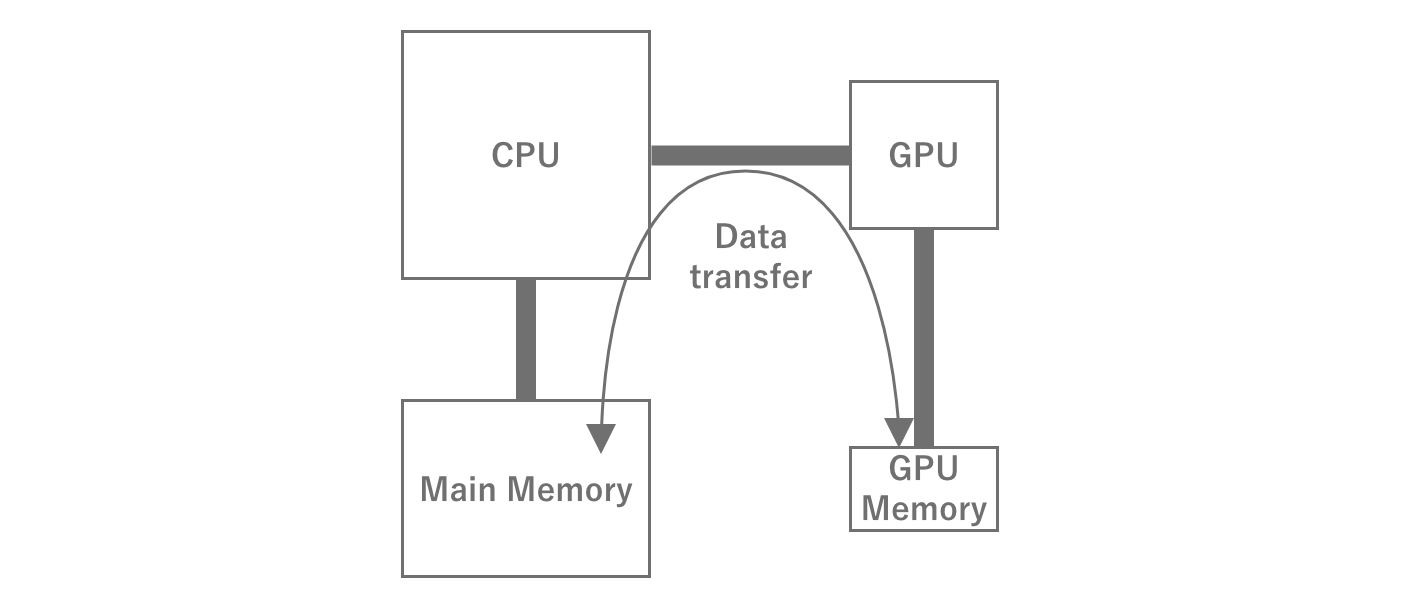
Figure 2.7: GPU Memory Transfer
In mobile devices, however, the main memory is generally shared between the CPU and GPU, rather than being dedicated to the GPU.While this has the advantage of dynamically changing the memory capacity of the GPU, it has the disadvantage of sharing the transfer bandwidth between the CPU and GPU.In this case, data must still be transferred between the CPU and GPU memory areas.
GPGPU
GPUs can perform parallel operations on large amounts of data at high speed, which CPUs are not good at. GPGPU (General Purpose GPU) GPGPU, General Purpose GPU.In particular, there are many cases where GPUs are used for machine learning such as AI and computational processing such as blockchain, which has led to a sharp increase in the demand for GPUs, resulting in a price hike and other effects.GPGPU can also be used in Unity by utilizing a function called Compute Shader.
2.1.5. Memory
Basically, all data is held in main memory, as the CPU only holds the data necessary for the calculation at that time.Since it is not possible to use more memory than the physical capacity, if too much is used, the memory cannot be allocated and the process is forced to terminate by the OS.This is generally referred to as OOM (Out Of Memory) This is commonly referred to as OOM, Out Of Memory, and is called "killed.As of 2022, the majority of smartphones are equipped with 4-8 GB of memory capacity.Even so, you should be careful not to use too much memory.
Also, as mentioned above, since memory is separated from the CPU, performance itself will vary depending on whether or not memory-aware implementation is used.In this section, we will explain the relationship between programs and memory so that performance-conscious implementation can be performed.
Memory Hardware
Although it is advantageous to have the main memory inside the SoC due to the physical distance, memory is not included in the SoC.There are reasons for this, such as the fact that the amount of memory installed cannot be changed from device to device if it is included in the SoC.However, if the main memory is slow, it will noticeably affect program execution speed, so a relatively fast bus is used to connect the SoC and memory.The memory and bus standards commonly used in smartphones are LPDDR is the LPDDR standard.There are several generations of LPDDR, but the theoretical transfer rate is several Gbps.Of course, it is not always possible to achieve the theoretical performance, but in game development, this is rarely a bottleneck, so there is no need to be aware of it.
Memory and OS
Within an OS, there are many processes running simultaneously, mainly system processes and user processes.The system processes play an important role in running the OS, and most of them reside in the OS as services and continue to run regardless of the user's intention.On the other hand, user processes are processes that are started by the user and are not essential for the OS to run.
There are two display states for apps on smartphones: foreground (foremost) and background (hidden).Generally, when a particular app is in the foreground, other apps are in the background.While an app is in the background, the process exists in a suspended state to facilitate the return process, and memory is maintained as it is.However, when the memory used by the entire system becomes insufficient, the process is killed according to the priority order determined by the OS.At this time, the most likely to be killed are user applications (≒games) in the background that are using a lot of memory.In other words, games that use a lot of memory are more likely to be killed when they are moved to the background, resulting in a worse user experience when returning to the game and having to start all over again.
If there is no other process to kill when it tries to allocate memory, it will be killed itself.In some cases, such as iOS, it is controlled so that no more than a certain percentage of the physical memory can be used by a single process.Therefore, there is a limit to the amount of memory that can be allocated.As of 2022, the limit for an iOS device with 3GB of RAM, which is a major RAM capacity, will be 1.3~1.4GB, so this is likely to be the upper limit for creating games.
Memory Swap
In reality, there are many different hardware devices, some of which have very small physical memory capacity.In order to run as many processes as possible on such terminals, the OS tries to secure virtual memory capacity in various ways.This is memory swap.
One method used in memory swap is memory compression.Physical capacity is saved by compressing and storing in memory, mainly memory that will not be accessed for a while.However, because of the compression and decompression costs, it is not done for areas that are actively used, but for applications that have gone to the background, for example.
Another technique is to save storage of unused memory.On hardware with ample storage, such as a PC, instead of terminating processes to free up memory,it may try to free up physical memory by saving unused memory to storage.This has the advantage of securing a larger amount of memory than memory compression, but it is not used because storage is slower than memory, so there are strong performance limitations, andit is not very realistic for smartphones, which have a small storage size to begin with.
Stack and Heap
Stack and heap you may have heard the terms "stack" and "heap" at least once.The stack is actually a dedicated fixed area that is closely related to the operation of the program.When a function is called, the stack is allocated for arguments and local variables, and when the function returns to the original function, the stack is released and the return value is accumulated.In other words, when the next function is called within a function, the information of the current function is left as it is and the next function is loaded into memory.In this way, the function call mechanism is realized.Stack memory depends on the architecture, but since the capacity itself is very small (1 MB), only a limited amount of data is stored.
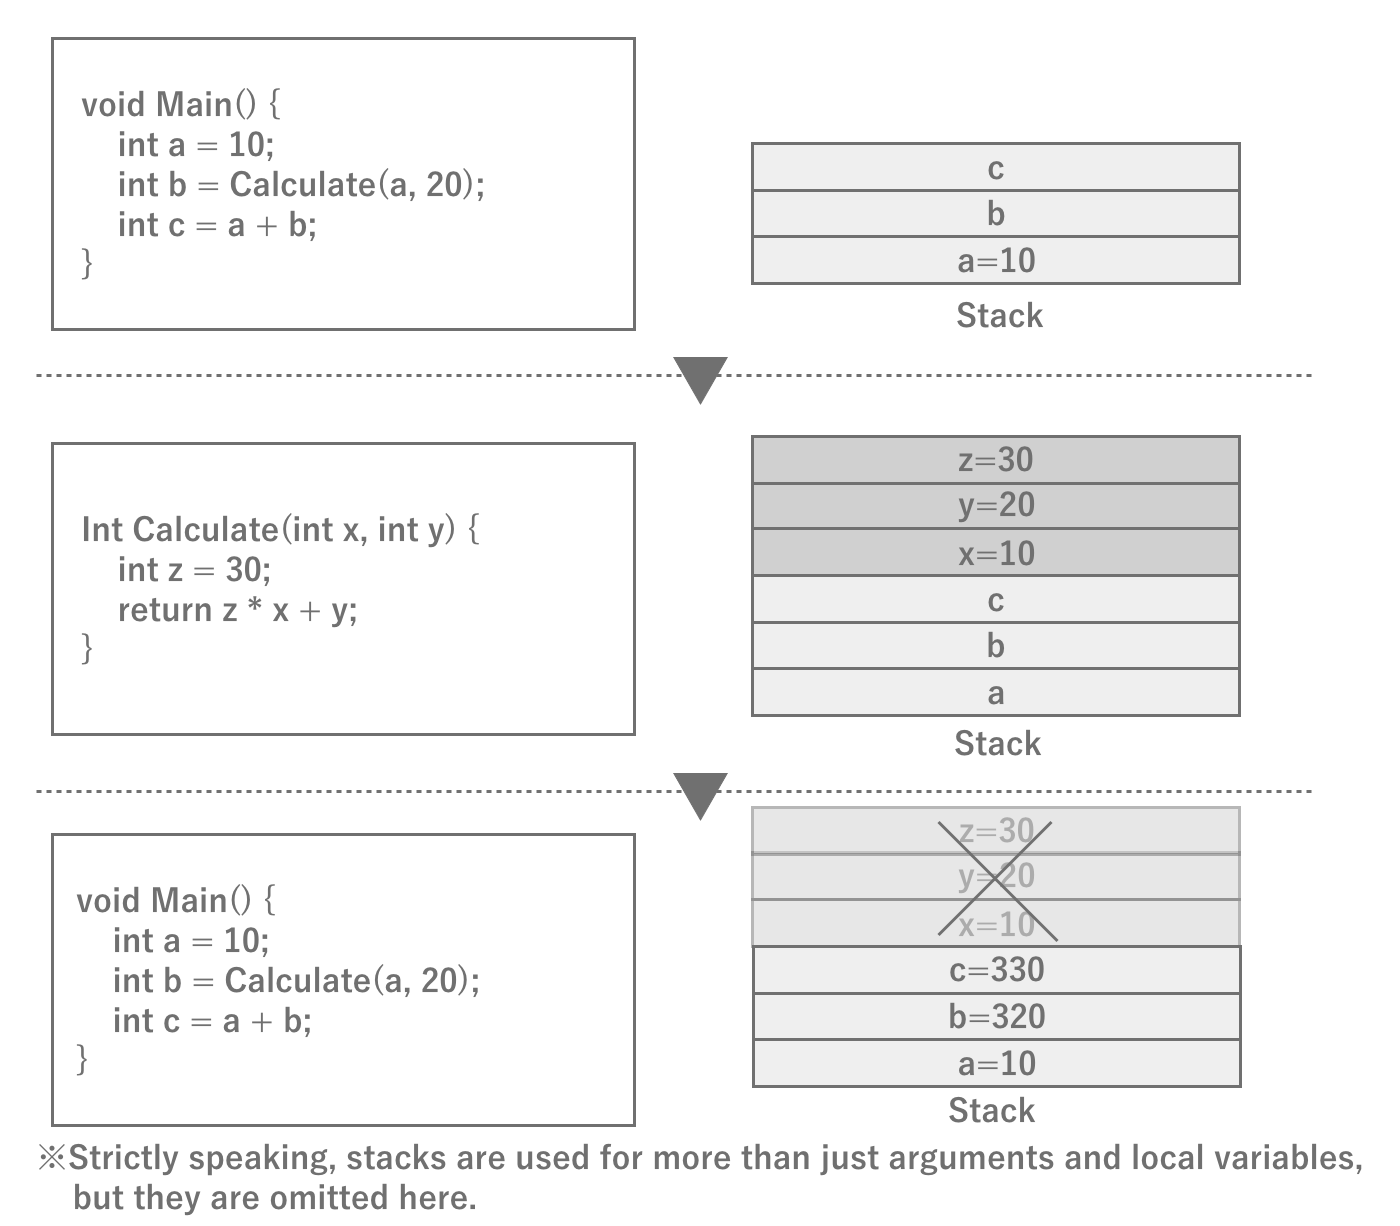
Figure 2.8: Schematic diagram of stack operation
The heap, on the other hand, is a memory area that can be freely used within the program.Whenever the program needs it, it can issue a memory allocation instruction (malloc in C) to allocate and use a large amount of data.Of course, when the program finishes using the memory, it needs to release it (free).In C#, memory allocation and deallocation are automatically performed at runtime, so implementors do not need to do this explicitly.
Since the OS does not know when and how much memory is needed, it allocates memory from the free space when it is needed.If the memory cannot be allocated continuously when the memory allocation is attempted, it is assumed to be out of memory.This keyword "consecutive" is important.In general, repeated allocation and deallocation of memory results in memory fragmentation occurs.When memory is fragmented, even if the total free space is sufficient, there may be no contiguous free space.In such a case, the OS will first try to Heap expansion to the heap.In other words, it allocates new memory to be allocated to processes, thereby ensuring contiguous space.However, due to the finite memory of the entire system, the OS will kill the process if there is no more memory left to allocate.
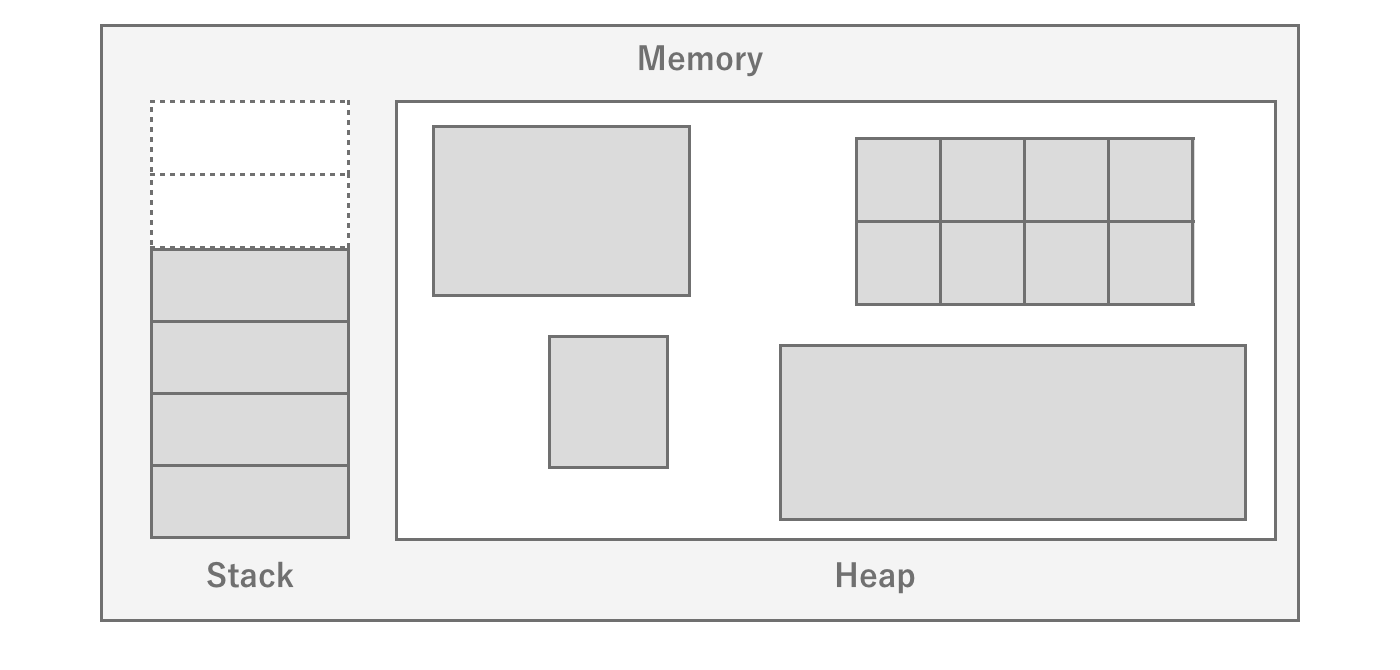
Figure 2.9: Stack and Heap
There is a noticeable difference in memory allocation performance when comparing stack and heap.This is because the amount of stack memory required for a function is determined at compile time, so the memory area is already allocated, whereas theheap does not know the amount of memory required until execution, so the heap allocates memory by searching for it in the free area each time.This is why heap is slow and stack is fast.
Stack Overflow Error
The Stack Overflow error occurs when stack memory is used up due to recursive calls to functions.The default stack size for iOS/Android is 1MB, so this error is more likely to occur when the size of recursive calls increases.In general, it is possible to prevent this error by changing to an algorithm that does not result in recursive calls, or by changing to an algorithm that does not allow recursive calls to become too deep.
2.1.6. Storage
When you actually proceed with tuning, you may notice that it often takes a long time to read a file.Reading a file means reading data from the storage where the file is stored and writing it to memory so that it can be handled by the program. Knowing what is actually happening there is useful when tuning.
First, a typical hardware architecture will have dedicated storage for persistent data.Storage is characterized by its large capacity and its ability to persist data without a power supply (nonvolatile).Taking advantage of this feature, a vast amount of assets as well as the program of the application itself are stored in the storage, and are loaded from the storage and executed at startup, for example.
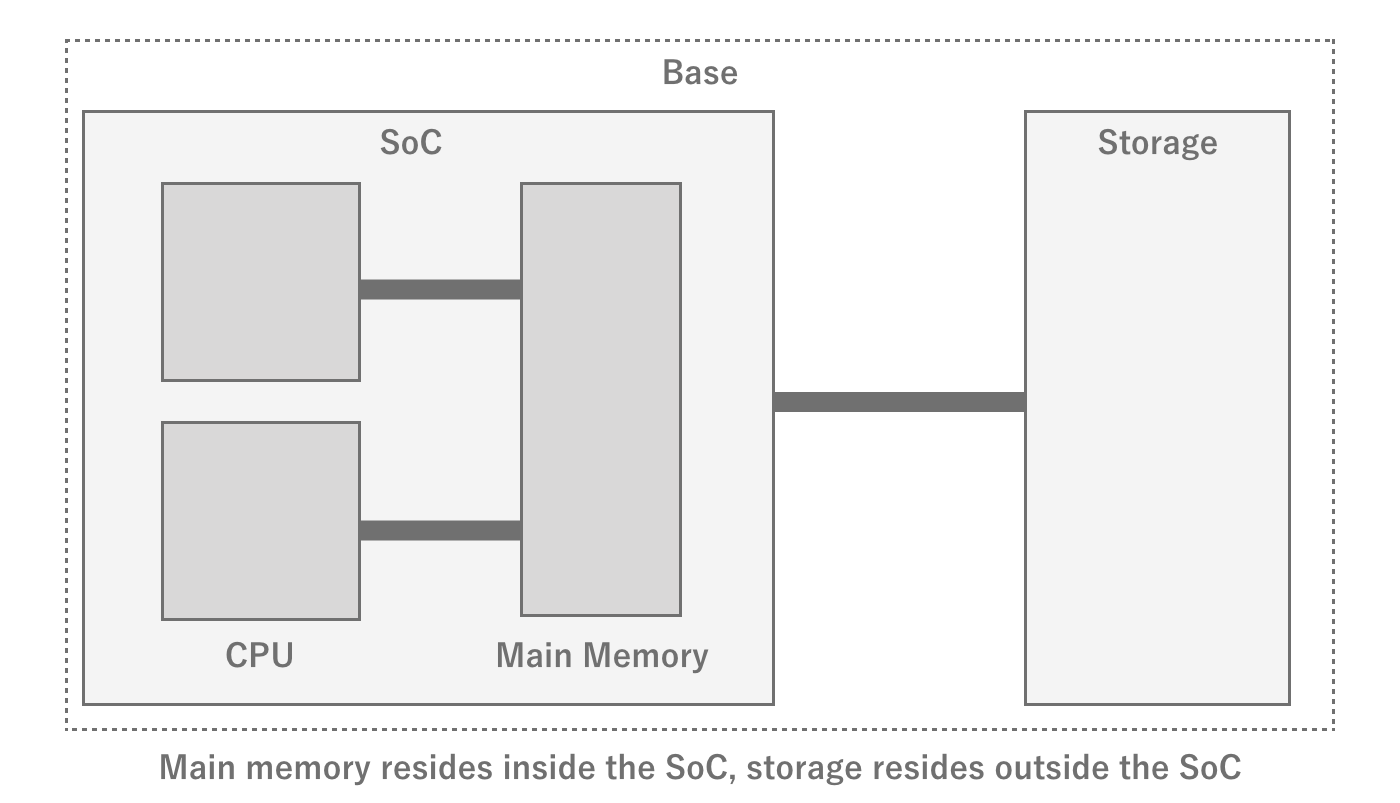
Figure 2.10: Relationship between SoC and Storage
RAM and ROM
Especially in Japan, it is common to write "RAM" for smartphone memory and "ROM" for storage, but ROM actually refers to Read Only Memory.As the name suggests, it is supposed to be read-only and not writable, but the use of this term seems to be strongly customary in Japan.
However, the process of reading and writing to this storage is very slow compared to the program execution cycle from several perspectives.
- The physical distance from the CPU is greater than that of memory, resulting in large latency and slow read/write speeds.
- There is a lot of waste because reads are done in block units, including the commanded data and its surroundings.
- Sequential read/write is fast, while random read/write is slow.
The fact that random read/write is slow is particularly important.To begin with, sequential read/write and random read/write are sequential when a single file is read/written in order from the beginning of the file.However, when reading/writing multiple parts of a single file or reading/writing multiple small files at once, it is random. If you are reading/writing multiple parts of a file, or reading/writing multiple small files, it will be random.It is important to note that even when reading/writing multiple files in the same directory, they may not be physically located consecutively, so if they are physically far apart, they will be randomized.
The process of reading from storage
When reading a file from storage, the details are omitted, but the process roughly follows the flow below.
The 1. program commands the storage controller the area of the file to be read from storageThe 2. storage controller receives the command and calculates the area to be read on the physical where the data is located3. Reads the data4. Writes the data in memoryThe 5. program accesses the data through memory
There may also be more layers, such as controllers, depending on the hardware and architecture.It is not necessary to remember them exactly, but be aware that there are more hardware processing steps compared to reading from memory.
Also, typical storage achieves performance and space efficiency by writing a single file in blocks of 4KB or so.These blocks are not necessarily physically contiguous, even if they are a single file.The state in which files are physically distributed is called fragmentation (fragmentation) and the operation to eliminate fragmentation is called defragmentation is called defragmentation.While fragmentation was often a problem with HDDs, which were the mainstay of PCs, it has almost disappeared with the advent of flash storage.While we do not need to be aware of file fragmentation in smartphones, it is important to be aware of it when considering PCs.
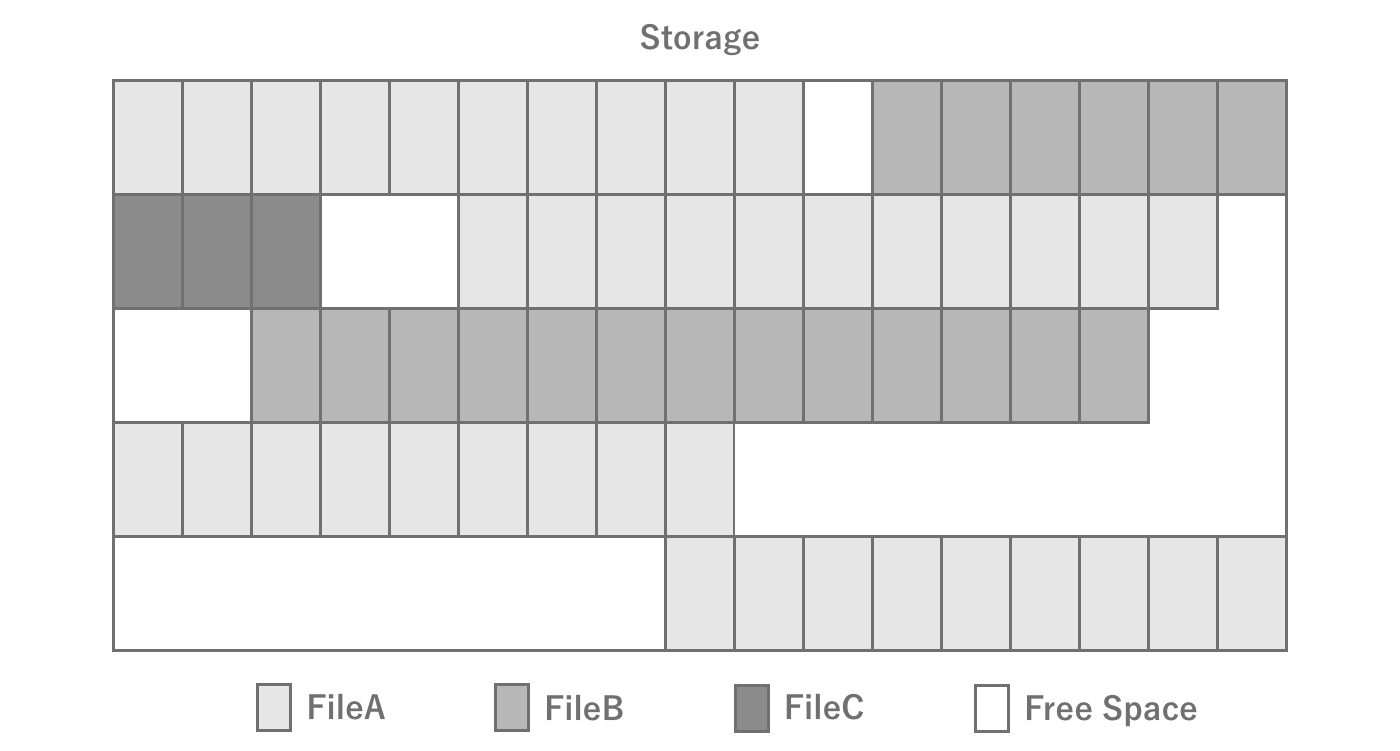
Figure 2.11: Storage fragmentation
Types of storage in PCs and smartphones
In the PC world, HDDs and SSDs are the most common types of storage; you may not have seen HDDs before, but they are media that are recorded in the form of disks, like CDs, with heads that move over the disks to read the magnetism.As such, it was a device that was structurally large and had high latency due to the physical movement involved.In recent years, SSDs have become popular. Unlike HDDs, SSDs do not generate physical movement and therefore offer high-speed performance, but on the other hand, they have a limit to the number of read/write cycles (lifespan), so they become unusable when frequent read/write cycles occur.Although smartphones are different from SSDs, they use a type of flash memory called NAND.
Finally, how fast is the actual read/write speed of storage in a smartphone? As of 2022, one estimate is about 100 MB/s for reading.If you want to read a 10 MB file, it will take 100 ms to read the entire file, even under ideal conditions.Furthermore, if multiple small files are to be read, random accesses will occur, making the reading process even slower.Thus, it is always good to be aware that it actually takes a surprisingly long time to read a file.As for the specific performance of individual terminals, you can refer to *1, a site that collects benchmark results.
Finally, to summarize, when reading and writing files, it is a good idea to be aware of the following points
- Storage read/write speeds are surprisingly slow, and do not expect the same speed as memory
- Reduce the number of files to be read/written at the same time as much as possible (e.g., distribute timing, consolidate files into a single file, etc.)
2.2. Rendering
In games, rendering workloads often have a negative impact on performance.Therefore, knowledge of rendering is essential for performance tuning.Therefore, this section summarizes the fundamentals of rendering.
2.2.1. Rendering Pipeline
In computer graphics, a series of processes are performed on data such as the vertex coordinates of a 3D model and the coordinates and colors of lights to finally output the colors to be output to each pixel on the screen.This processing mechanism is called the rendering pipeline is called the rendering pipeline.
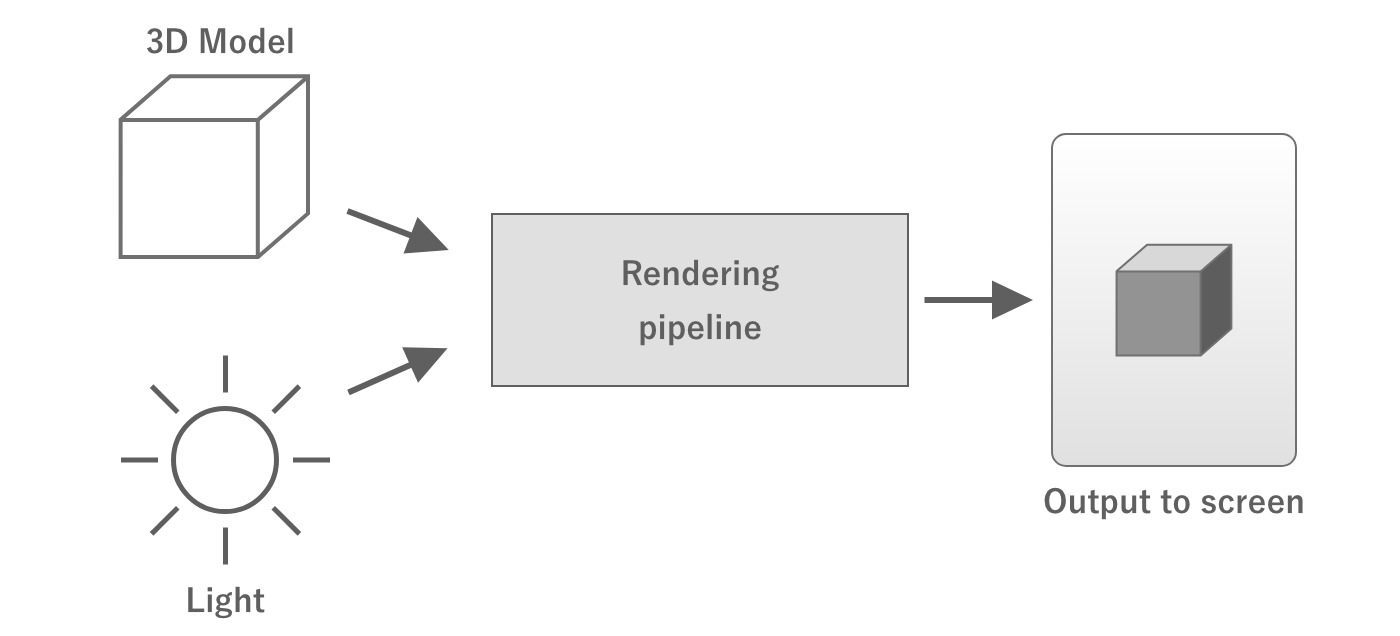
Figure 2.12: Rendering Pipeline
The rendering pipeline starts with sending the necessary data from the CPU to the GPU.This data includes the coordinates of the vertices of the 3D model to be rendered, the coordinates of the lights, the material information of the objects, the camera information, and so on.
At this point, the data sent are the coordinates of the 3D model's vertices, camera coordinates, orientation, angle of view, etc., each of which is individual data.The GPU compiles this information and calculates where the object will appear on the screen when it is viewed with the camera.This process is called coordinate transformation.
Once the position of the object on the screen is determined, the next step is to determine the color of the object.The GPU then calculates the color of the object by asking, "What color will the corresponding pixels on the screen be when the light illuminates the model?
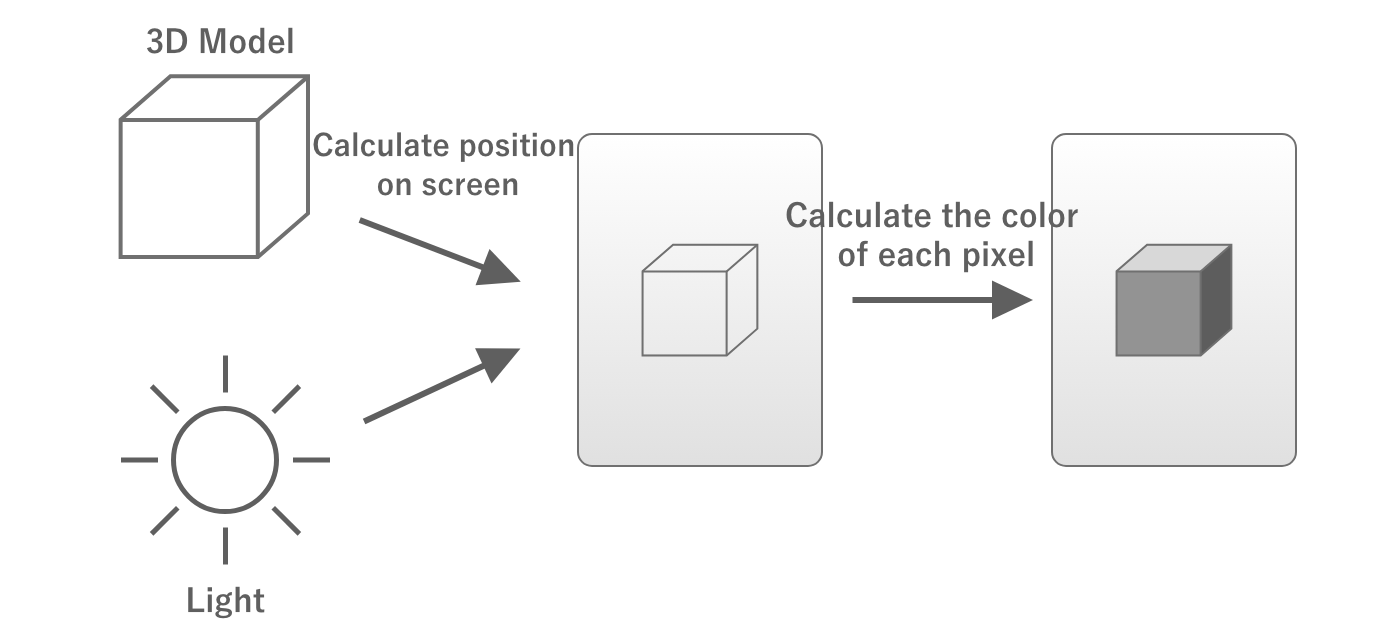
Figure 2.13: Calculating Position and Color
In the above process, "where on the screen the object will appear" is determined by the Vertex Shader and "the color of the area corresponding to each pixel on the screen" is calculated by a program called fragment shader and "what color the corresponding part of each pixel on the screen will be" is calculated by a program called the fragment shader.
These shaders can be freely written.Therefore, writing heavy processing in the vertex shaders and fragment shaders will increase the processing load.
Also, the vertex shader processes the number of vertices in the 3D model, so the more vertices there are, the greater the processing load.Fragment shaders increase the processing load as the number of pixels to be rendered increases.
Actual rendering pipeline
In the actual rendering pipeline, there are many processes other than vertex shaders and fragment shaders, but since the purpose of this document is to understand the concepts necessary for performance tuning, we will only give a brief description.
2.2.2. Semi-transparent rendering and overdraw
When rendering, the transparency of the object in question is an important issue.For example, consider two objects that are partially overlapped when viewed from the camera.
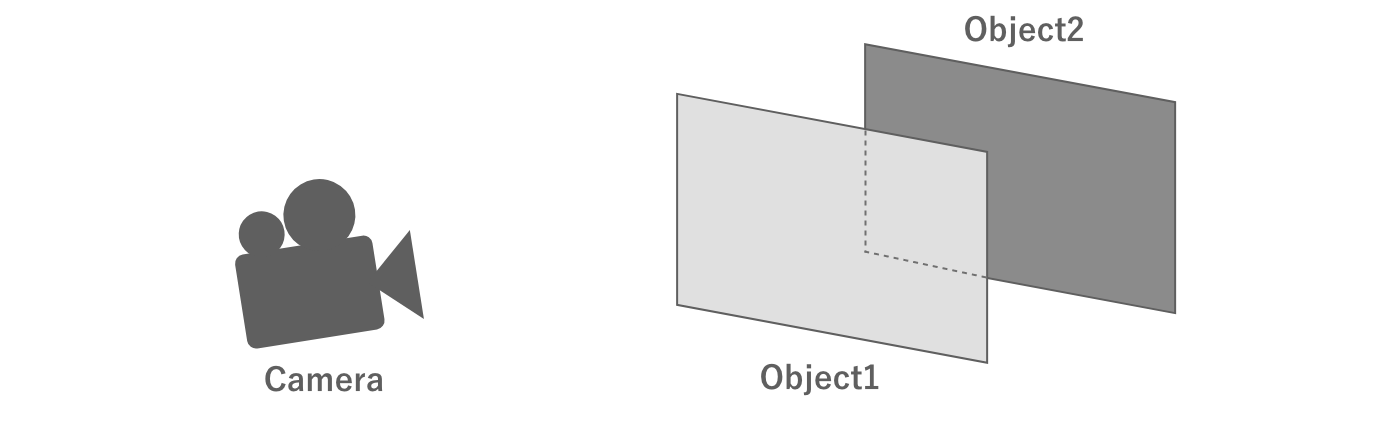
Figure 2.14: Two overlapping objects
First, consider the case where both of these objects are opaque.In this case, the objects in front of the camera are drawn first.In this way, when drawing the object in the back, the part of the object that is not visible because it overlaps the object in the front does not need to be processed. This means that the fragment shader operation can be skipped in this area, thus optimizing the processing load.
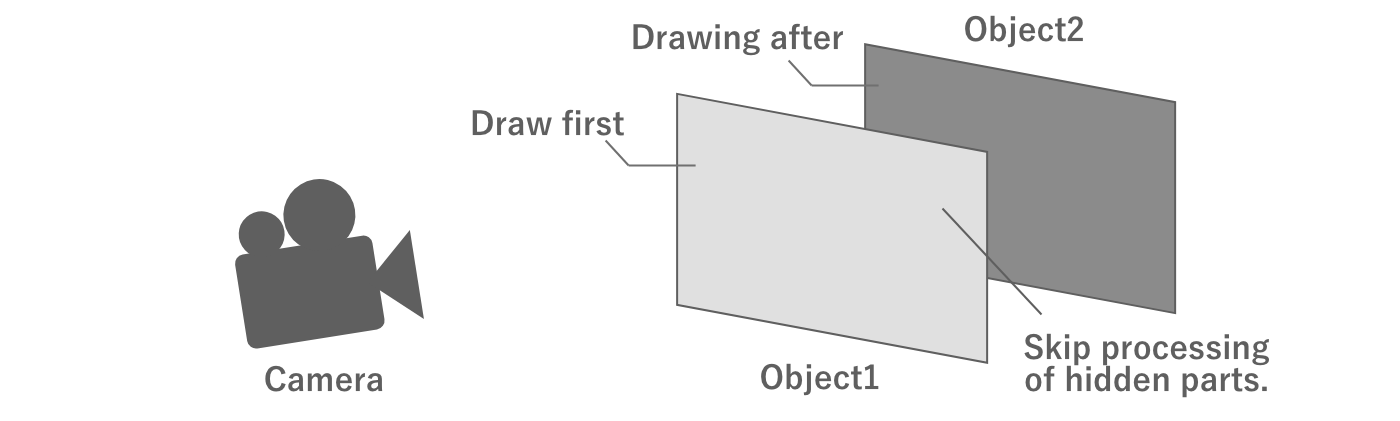
Figure 2.15: Opaque rendering
On the other hand, if both objects are semi-transparent, it would be unnatural if the back object is not visible through the front object, even if it overlaps the front object. In this case, the drawing process is performed starting with the object in the back as seen from the camera, and the color of the overlapping area is blended with the already drawn color.
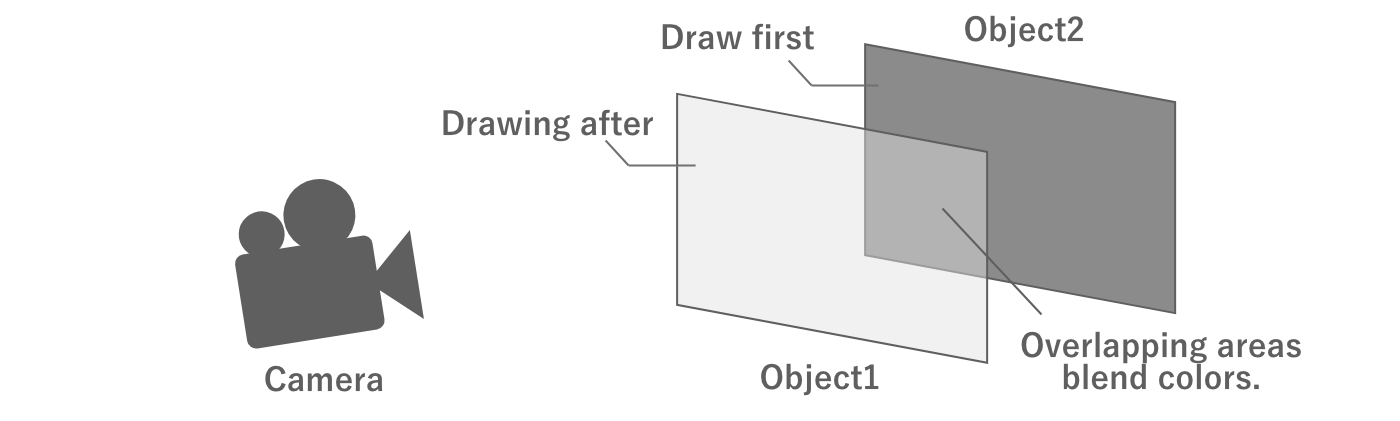
Figure 2.16: Semi-transparent rendering
Unlike opaque rendering, semi-transparent rendering requires rendering of overlapping objects.If there are two semi-transparent objects that fill the entire screen, the entire screen will be processed twice. Thus, drawing semi-transparent objects on top of each other is called overdraw is called "overdraw. Too many overdraws can put a heavy processing load on the GPU and lead to performance degradation, so it is necessary to set appropriate regulations when drawing semi-transparent objects.
Assuming forward rendering
There are several ways to implement the rendering pipeline. Of these, the description in this section assumes forward rendering. Some points may not be partially applicable to other rendering methods such as deferred rendering.
2.2.3. Draw calls, set-pass calls, and batching
Rendering requires a processing load not only on the GPU but also on the CPU.
As mentioned above, when rendering an object, the CPU sends commands to the GPU to draw.This is called a draw call and is executed as many times as the number of objects to be rendered.At this time, if the texture or other information is different from that of the object rendered in the previous draw call, the CPU will set the texture or other information to the GPU. This is done using the set path call and is a relatively heavy process. Since this process is done on the CPU's render thread, it is a processing load on the CPU, and too much of it can affect performance.
Unity has a feature to reduce draw calls called draw call batching to reduce draw calls.This is a mechanism whereby meshes of objects with the same texture and other information (i.e., the same material) are combined in CPU-side processing in advance and drawn with a single draw call.Batching at runtime Dynamic batching and the merged mesh is created in advance. Static batching which creates a combined mesh in advance.
There is also a Scriptable Render Pipeline also has an SRP Batcher mechanism.Using this mechanism, set-pass calls can be combined into a single call, even if the mesh and material are different, as long as the shader variants are the same.This mechanism does not reduce the number of draw calls, but it does reduce the set-pass calls, since these are the ones that are the most expensive to process.
For more information on these batching arrangements, see "7.3 Reducing Draw Calls".
GPU Instancing
A feature that has a similar effect to batching is GPU Instancing is GPU instancing.This function uses the GPU's ability to draw objects with the same mesh in a single draw call or set-path call.
2.3. Data Representation
Games use a variety of data, including images, 3D models, audio, and animation.Knowing how these are represented as digital data is important for calculating memory and storage capacity and for properly configuring settings such as compression.This section summarizes the basic data representation methods.
2.3.1. Bits and Bytes
The smallest unit a computer can represent is the bit.A bit can represent the range of data that can be represented by a single binary digit, i.e., a combination of 0 and 1.This can only represent simple information, such as turning a switch on and off, for example.

Figure 2.17: Amount of information in one bit
If we use two bits, we can express the range that can be represented by two digits of binary numbers, in other words, four combinations.Since there are four combinations, it is possible to express, for example, which key was pressed: up, down, left, or right.
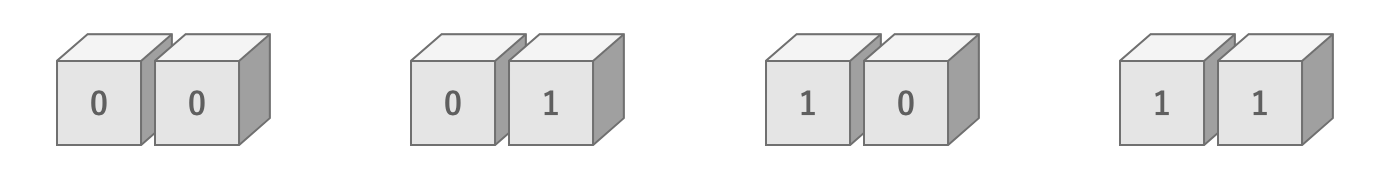
Figure 2.18: 2 bits of information
Similarly, 8 bits can represent a range of 8 binary digits, i.e., 2 ways ^ 8 digits = 256 ways.At this point, it seems that a variety of information can be expressed.These 8 bits are expressed in the unit of 1 byte.In other words, one byte is a unit that can express 256 different amounts of information.
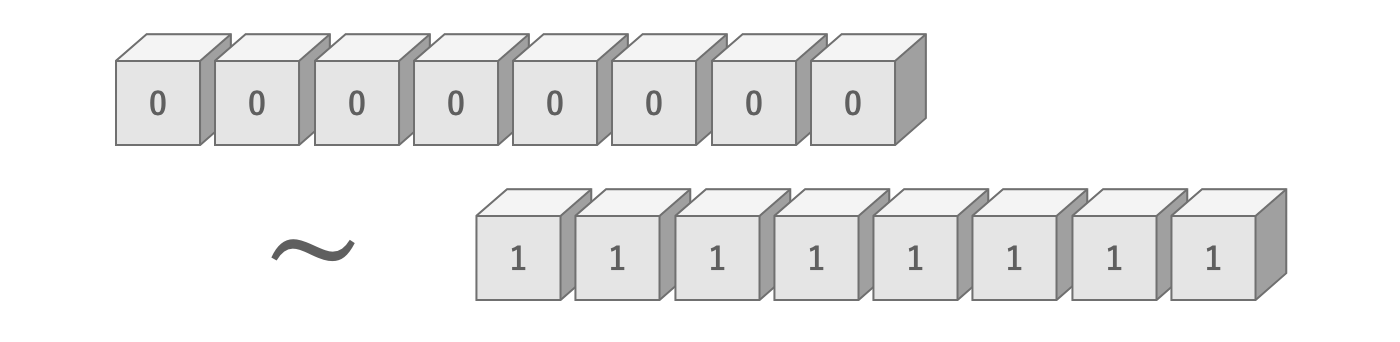
Figure 2.19: Amount of information in 8 bits
There are also units that represent larger numbers, such as the kilobyte (KB), which represents 1,000 bytes, and the megabyte (MB), which represents 1,000 kilobytes.
Kilobyte and Kibibyte
Above, 1 KB is written as 1,000 bytes, but in some contexts, 1 KB may be referred to as 1,024 bytes.When explicitly referring to them differently, 1,000 bytes is called 1 kilobyte (KB) and 1,024 bytes is called 1 kibibibyte (KiB).The same is true for megabytes.
2.3.2. Image
Image data is represented as a set of pixels.For example, an 8 × 8 pixel image consists of a total of 8 × 8 = 64 pixels.
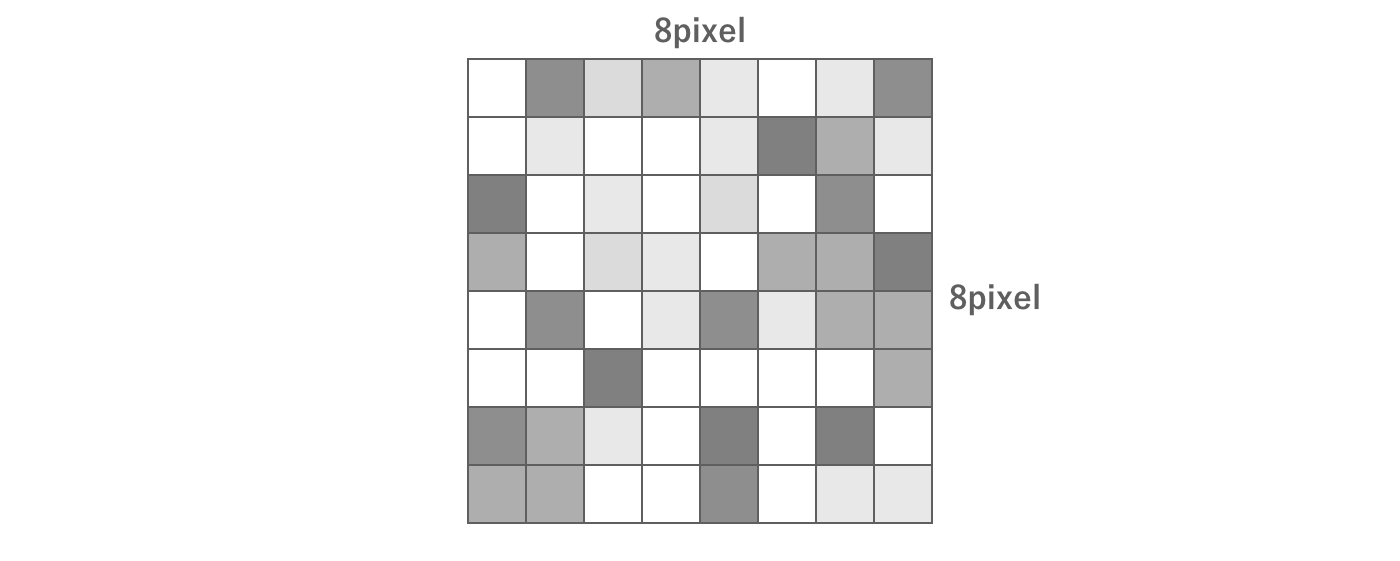
Figure 2.20: Image Data
In this case, each pixel has its own color data.So how is color represented in digital data?
First, color is created by combining four elements: red (Red), green (Green), blue (Blue), and transparency (Alpha).These are called channels, and each channel is represented by the initial letters RGBA.
In the commonly used True Color method of color representation, each RGBA value is expressed in 256 steps.As explained in the previous section, 256 steps means 8 bits.In other words, True Color can be represented with 4 channels × 8 bits = 32 bits of information.
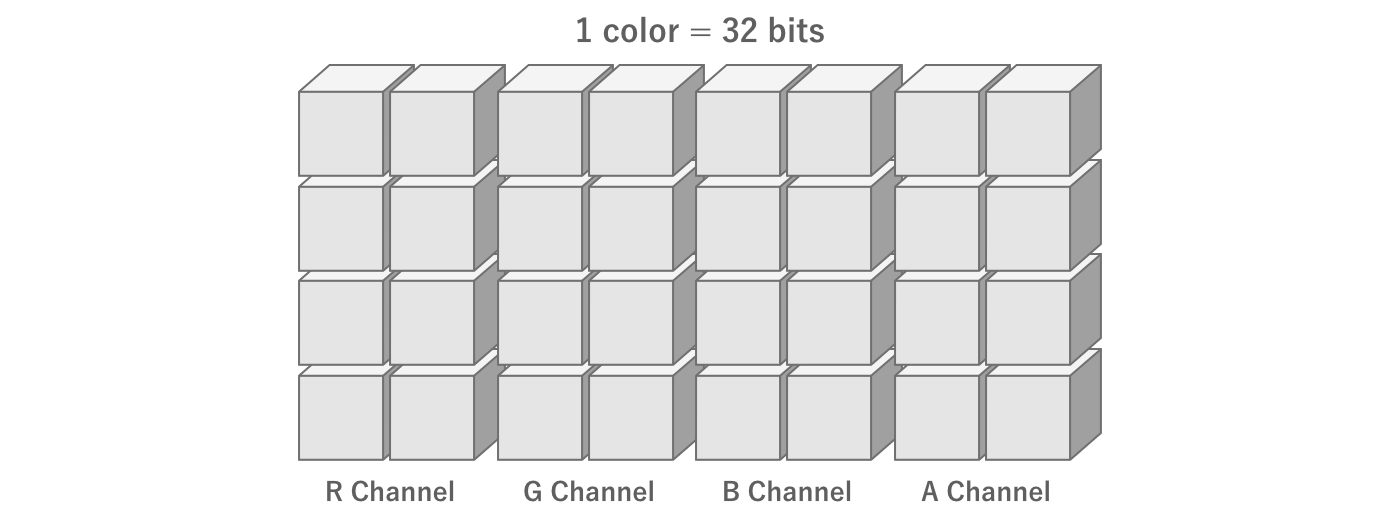
Figure 2.21: Amount of information per color
Thus, for example, an 8 × 8 pixel True Color image has 8 pixels × 8 pixels × 4 channels × 8 bits = 2,048 bits = 256 bytes.For a 1,024 × 1,024 pixel True Color image, its information content would be 1,024 pixels × 1,024 pixels × 4 channels × 8 bits = 33,554,432 bits = 4,194,304 bytes = 4,096 kilobytes = 4 megabytes.
2.3.3. Image Compression
In practice, images are most often used as compressed data.
Compression is the process of reducing the amount of data by devising a way to store the data.For example, suppose there are five pixels with the same color next to each other.In this case, rather than having five color information for each pixel, it is better to have one color information and the information that there are five pixels in a row, which reduces the amount of information.

Figure 2.22: Compression
In reality, there are many more complex compression methods.
As a concrete example, let us introduce ASTC, a typical mobile compression format.Applying the format ASTC6x6, a 1024x1024 texture is compressed from 4 megabytes to about 0.46 megabytes.In other words, the result is that the capacity is compressed to less than one-eighth of its original size, and we can recognize the importance of compression.
For reference, the compression ratio of the ASTC format, which is mainly used in mobile devices, is described below.
Table 2.2: Compression Format and Compression Ratio
| Compression Format | Compression ratio |
|---|---|
| ASTC RGB(A) 4x4 | 0.25 |
| ASTC RGB(A) 6x6 | 0.1113 |
| ASTC RGB(A) 8x8 | 0.0625 |
| ASTC RGB(A) 10x10 | 0.04 |
| ASTC RGB(A) 12x12 | 0.0278 |
In Unity, various compression methods can be specified for each platform using the texture import settings.Therefore, it is common to import an uncompressed image and apply compression according to the import settings to generate the final texture to be used.
GPUs and Compression Formats
Images compressed according to a certain rule must, of course, be decompressed according to that rule.This decompression is done at runtime.To minimize this processing load, it is important to use a compression format that is supported by the GPU.ASTC is a typical compression format supported by GPUs on mobile devices.
2.3.4. Mesh
In 3DCG, a three-dimensional shape is expressed by connecting many triangles in 3D space.This collection of triangles is called a mesh is called a mesh.
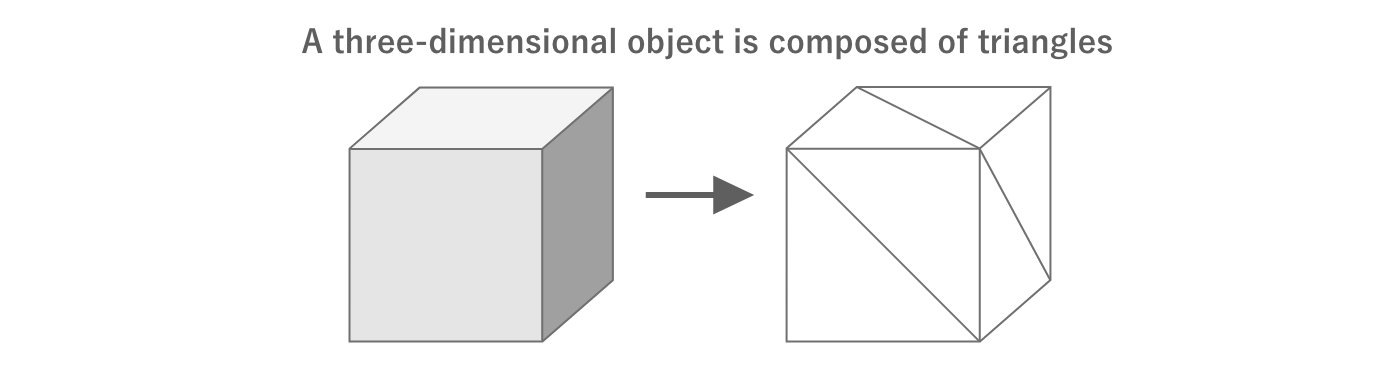
Figure 2.23: 3D by combining triangles
The triangles can be represented as the coordinate information of three points in 3D space.Each of these points is called a vertex and its coordinates are called vertex coordinates and their coordinates are called vertex coordinates.All vertex information per mesh is stored in a single array.

Figure 2.24: Vertex Information
Since the vertex information is stored in a single array, we need additional information to indicate which of the vertices will be combined to form a triangle.This is called the vertex index and is represented as an array of type int that represents the index of the array of vertex information.

Figure 2.25: Vertex Index
Additional information is needed for texturing and lighting objects.For example, mapping a texture requires UV coordinates.Lighting also requires information such as vertex color, normals, and tangents.
The following table summarizes the main vertex information and the amount of information per vertex.
Table 2.3: Vertex Information
| Name | Amount of information per vertex |
|---|---|
| Vertex coordinates | 3D float = 12 bytes |
| UV coordinates | 2D float = 8 bytes |
| Vertex color | 4-dimensional float = 16 bytes |
| Normal | 3-dimensional float = 12 bytes |
| Tangent | 3D float = 12 bytes |
It is important to determine the number of vertices and the type of vertex information in advance because mesh data grows as the number of vertices and the amount of information handled by a single vertex increases.
2.3.5. Keyframe Animation
Games use animation in many areas, such as UI animation and 3D model motion.Keyframe animation is one of the most common ways to achieve animation.
A keyframe animation consists of an array of data representing values at a certain time (keyframe).The values between keyframes are obtained by interpolation and can be treated as if they were smooth, continuous data.
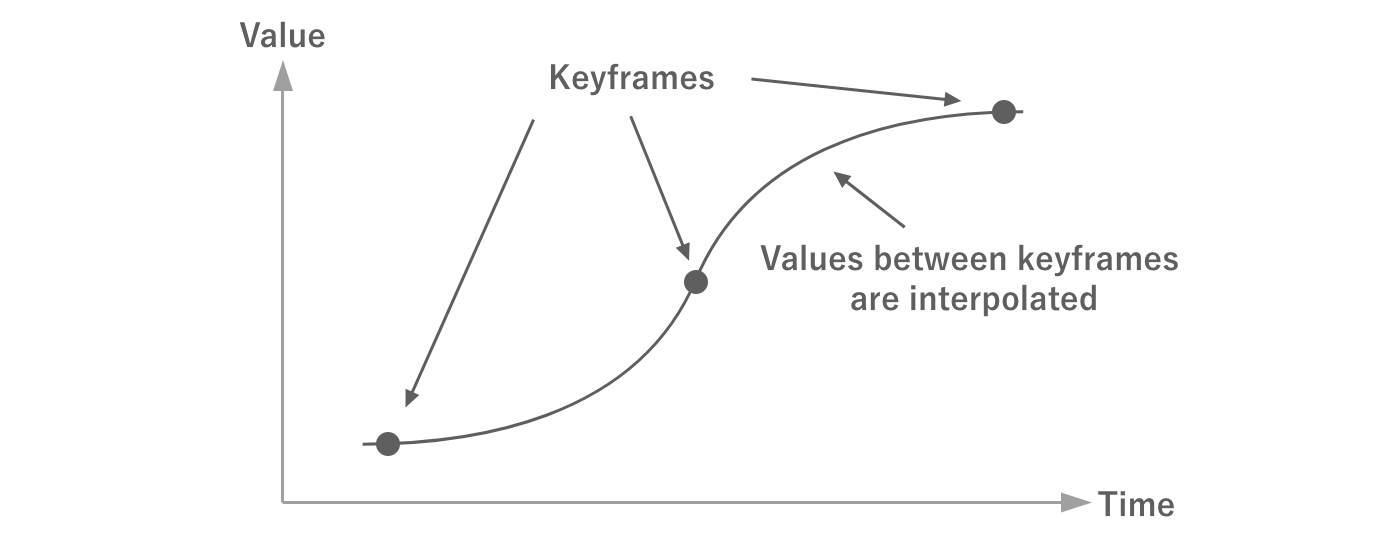
Figure 2.26: Keyframes
In addition to time and value, keyframes have other information such as tangents and their weights.By using these in the interpolation calculation, more complex animations can be realized with less data.
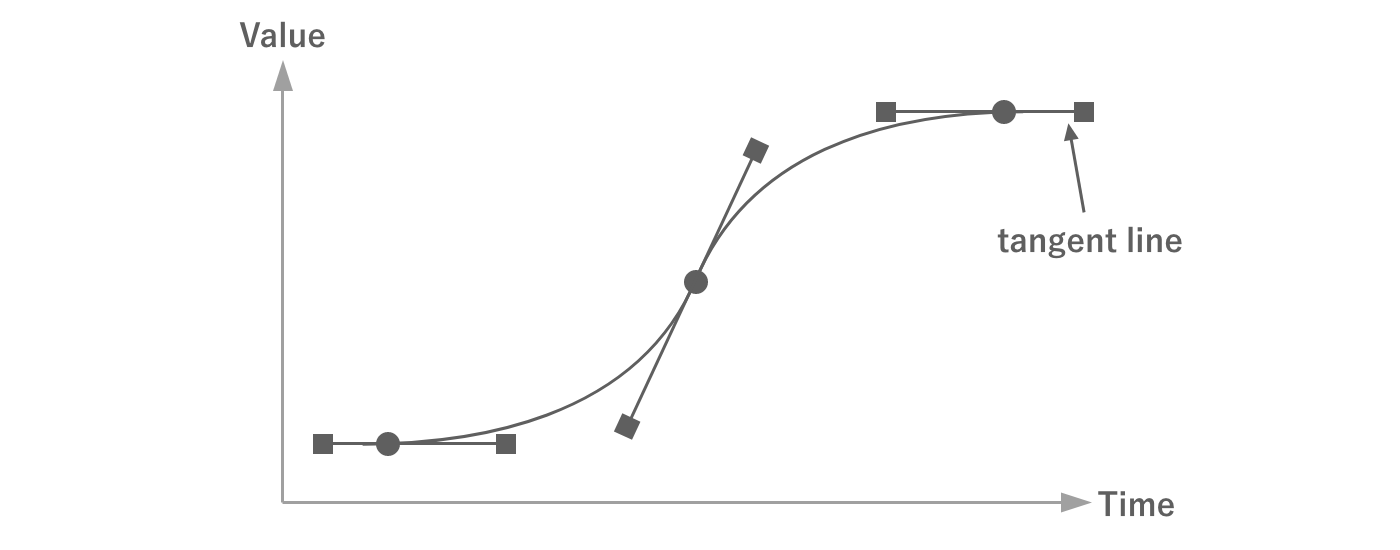
Figure 2.27: Tangents and Weights
In keyframe animation, the more keyframes there are, the more complex the animation can be.However, the amount of data also increases with the number of keyframes.For this reason, the number of keyframes should be set appropriately.
There are methods to compress the amount of data by reducing the number of keyframes while keeping the curves as similar as possible.In Unity, keyframes can be reduced in the model import settings as shown in the following figure.
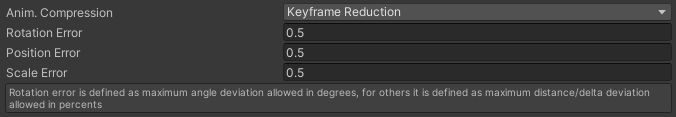
Figure 2.28: Import Settings
See "4.4 Animation" for details on how to set up the settings.
2.4. How Unity Works
Understanding how the Unity engine actually works is obviously important for tuning your game.This section explains the principles of Unity's operation that you should know.
2.4.1. Binaries and Runtime
First of all, this section explains how Unity actually works and how the runtime works.
C# and the Runtime
When creating a game in Unity, developers program the behavior in C#.C# is a compiler language, as it is often compiled (built) when developing games in Unity.However, C# differs from traditional C and other languages in that it is not a machine language that can be compiled and executed by itself on a machine, but rather it is an. Intermediate Language; henceforth IL The executable code that is converted to IL is called the "executable code".Since the executable code converted to IL cannot be executed by itself, it is executed while being converted to machine language using the .
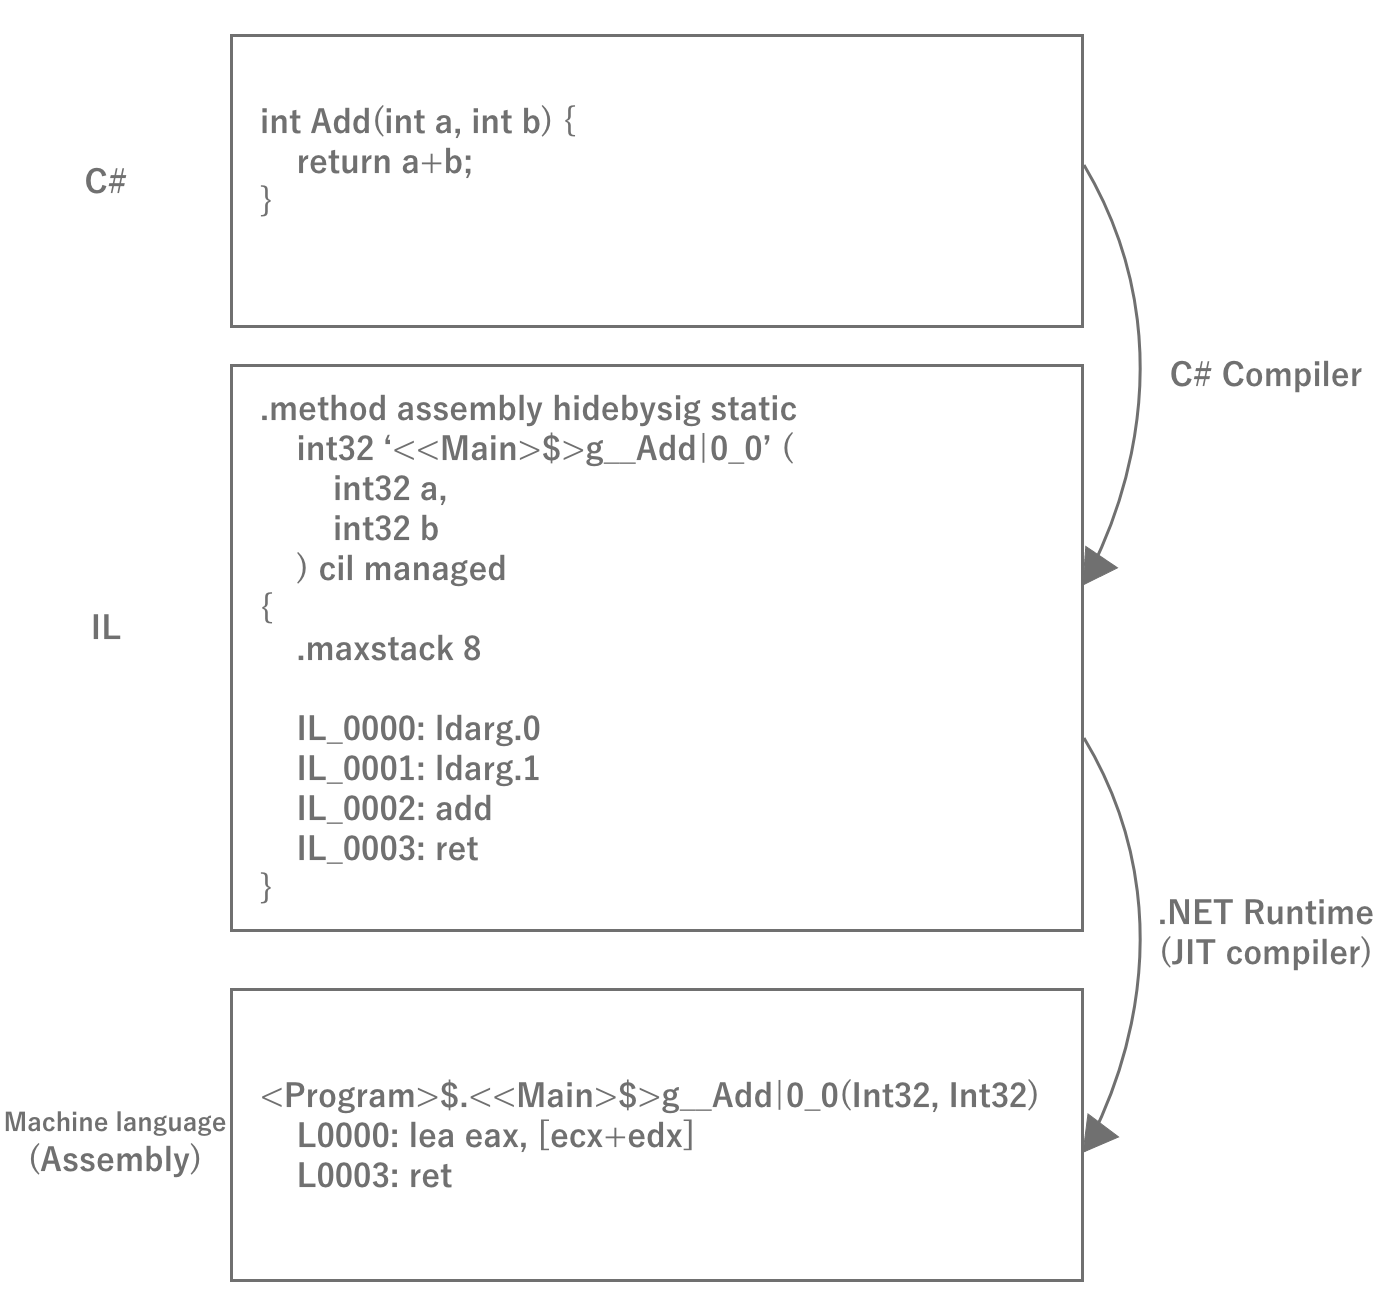
Figure 2.29: C# Compilation Process
The reason for interrupting IL once is that once converted to machine language, the binary can only be executed on a single platform.With IL, any platform can run simply by preparing a runtime for that platform, eliminating the need to prepare binaries for eachplatform.Therefore, the basic principle of Unity is that IL obtained by compiling the source code is executed on the runtime for the respective environment, thereby achieving multi-platform compatibility.
Let's check the IL code.
IL code, which is usually rarely seen, is very important to be aware of performance such as memory allocation and execution speed.For example, an array and a list will output different IL code for the same foreach loop at first glance, with the array being the better performing code.You may also find unintended hidden heap allocations.In order to acquire a sense of the correspondence between C# and IL code, it is recommended to check the IL conversion results of C# code you have written on a regular basis.You can view IL code in IDEs such as Visual Studio or Rider, but IL code itself is a difficult language to understand because it is a low-level language called assembly.In such cases, you can use a web service called SharpLab *2 to check C# -> IL -> C# and vice versa to make it easier to understand the IL code.An actual example of the conversion is presented at Chapter 10 "Tuning Practice - Script (C#)" in the latter half of this document.
[*2] https://sharplab.io/
IL2CPP
As mentioned above, Unity basically compiles C# into IL code and runs it at runtime, but starting around 2015, some environments started having problems.That is 64-bit support for apps running on iOS and Android.As mentioned above, C# requires a runtime to run in each environment to execute IL code.In fact, until then, Unity was actually a long-standing OSS implementation of the . Mono NET Framework OSS implementation, and Unity itself modified it for its own use.In other words, in order for Unity to become 64-bit compatible, it was necessary to make the forked Mono 64-bit compatible.Of course, this would require a tremendous amount of work, so Unity decided to use IL2CPP Unity overcame this challenge by developing a technology called IL2CPP instead.
IL2CPP is, as the name suggests, IL to CPP, a technology that converts IL code to C++ code.Since C++ is a highly versatile language that is natively supported in any development environment, it can be compiled into machine language in each development tool chain once it is output toC++ code.Therefore, 64-bit support is the job of the toolchain, and Unity does not have to deal with it.Unlike C#, C++ code is compiled into machine language at build time, eliminating the need to convert it to machine language at runtime and improving performance.
Although C++ code generally has the disadvantage of taking a long time to build, the IL2CPP technology has become a cornerstone of Unity, solving 64-bit compatibility and performance in one fell swoop.
Unity Runtime
By the way, although Unity allows developers to program games in C#, the runtime of Unity itself, called the engine, does not actually run in C#.The source itself is written in C++, and the part called the player is distributed pre-built to run in each environment.There are several possible reasons why Unity writes its engine in C++.
- To get fast and memory-saving performance
- To support as many platforms as possible
- To protect the intellectual property rights of the engine (black box)
Since the C# code written by the developer runs in C#, Unity requires two areas: the engine part, which runs natively, and the user code part, which runs at C# runtime.The engine and user code work by exchanging data as needed during execution.For example, when GameObject.transform is called from C#,all game execution state such as scene state is managed inside the engine, sofirst makes a native call to access memory data in the native area and then returns values toC#.It is important to note that memory is not shared between C# and native, so data needed by C# is allocated on the C# side each time it is needed.API calls are also expensive, with native calls occurring, so an optimization technique of caching values without frequent calls is necessary.
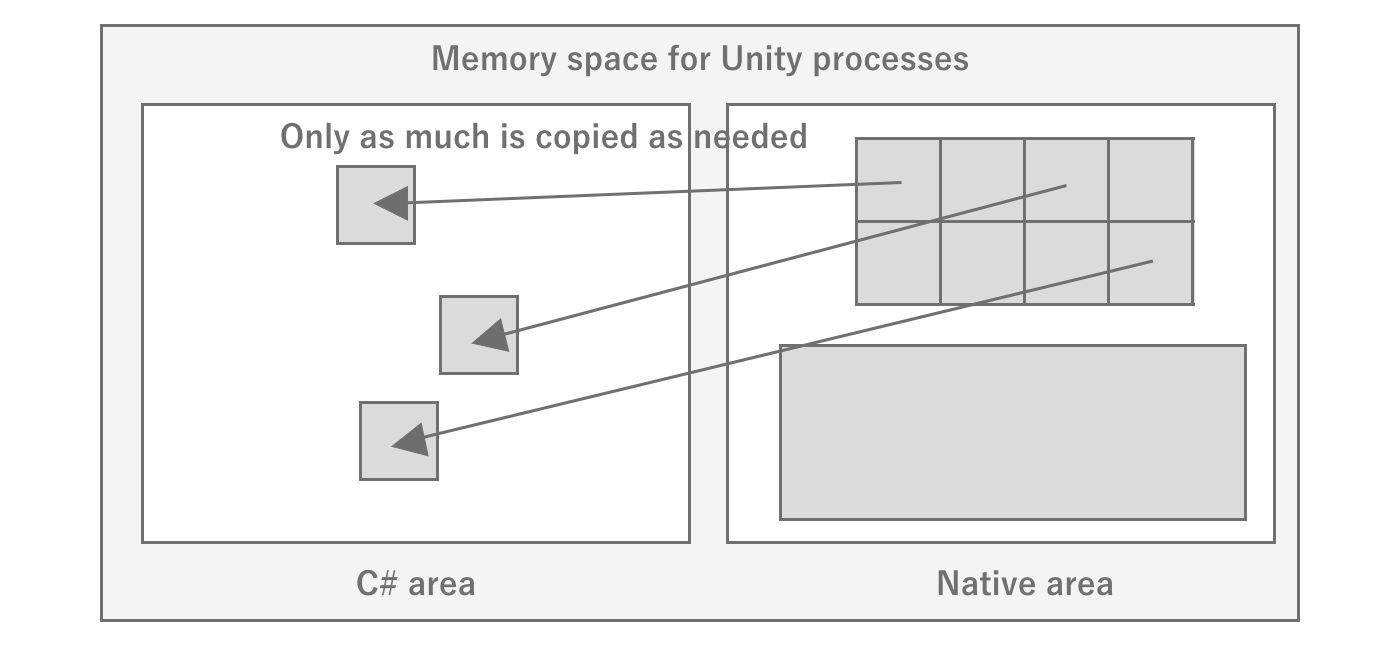
Figure 2.30: Image of memory state in Unity
In this way, when developing Unity, it is necessary to be aware of the invisible engine part to some extent.For this reason, it is a good idea to look at the source code of the interface between the native Unity engine and C#.Fortunately, Unity has made the C# part of the source code available on GitHub at *3, so you can see that it is mostly native calls, which is very helpful.I recommend making use of this if necessary.
2.4.2. Asset entities
As explained in the previous section, since the Unity engine runs natively, it basically has no data on the C# side.The same is true for the handling of assets: assets are loaded in the native area, and only references are returned to C#, or data is copied and returned.Therefore, there are two main ways to load assets: by specifying a path to load them on the Unity engine side, or by passing raw data such as byte arrays directly to the engine.If a path is specified, the C# side does not consume memory because it is loaded in the native area.However, if data such as a byte array is loaded and processed from the C# side and passed to the C# side, memory is doubly consumed on both the C# and native sides.
Also, since the asset entity is on the native side, the difficulty of investigating multiple asset loads and leaks increases.This is because developers mainly focus on profiling and debugging the C# side.It is difficult to understand the C# side execution state alone, and it is necessary to analyze it by comparing it with the engine side execution state.Profiling of the native area is dependent on the API provided by Unity, which limits the tools available.We will introduce methods for analysis using a variety of tools in this document, but it will be easier to understand if you are aware of the space between C# and native.
2.4.3. Threads
A thread is a unit of program execution, and processing generally proceeds by creating multiple threads within a single process.Since a single core of the CPU can only process one thread at a time,it executes the program while switching between threads at high speed to handle multiple threads.This is called context switch is called a context switch.Context switches incur overhead, so if they occur frequently, processing efficiency is reduced.
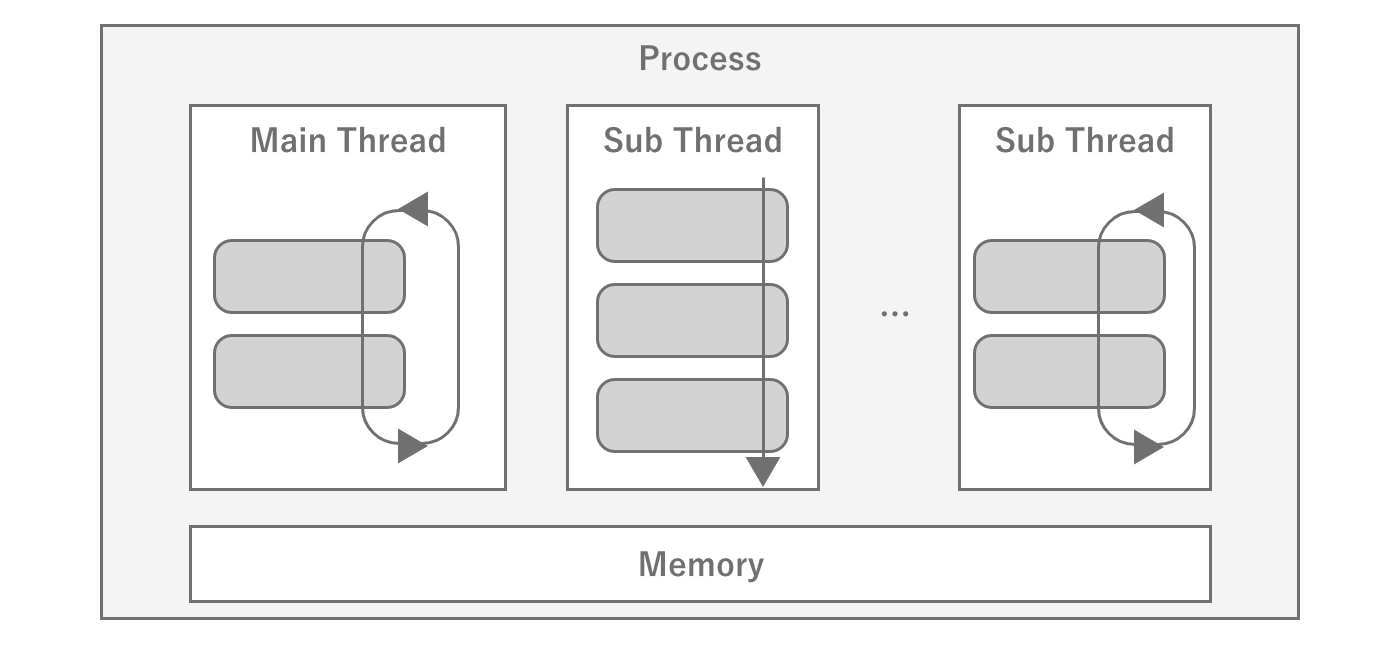
Figure 2.31: Schematic diagram of a thread
When a program is executed, the underlying main thread is created, from which the program creates and manages other threads as needed.Unity's game loop is designed to run on a single thread, so scripts written byusers will basically run on the main thread.Conversely, attempting to call Unity APIs from a thread other than the main thread will result in an error for most APIs.
If you create another thread from the main thread to execute a process, you do not know when that thread will be executed and when it will complete.Therefore, the means to synchronize processing between threads is to use the signal mechanism to synchronize processing between threads.When a thread is waiting for another thread to complete a process, it can be released by receiving a signal from that thread.This signal waiting is also used within Unity and can be observed during profiling, but it is important to note that it is just waiting for another process, as the name WaitFor~ implies.
Threads inside Unity
However, if every process is running in the main thread, the entire program will take a long time to process.If there are multiple heavy processes and they are not interdependent, it is possible to shortenprogram execution if parallel processing can be done by synchronizing the processes to some extent.To achieve such speed, a number of parallel processes are used inside the game engine.One of them is Render Thread one of them is the render thread.As the name suggests, it is a thread dedicated to rendering and is responsible for sending frame drawing information calculated by the main thread to the GPU asgraphics commands.
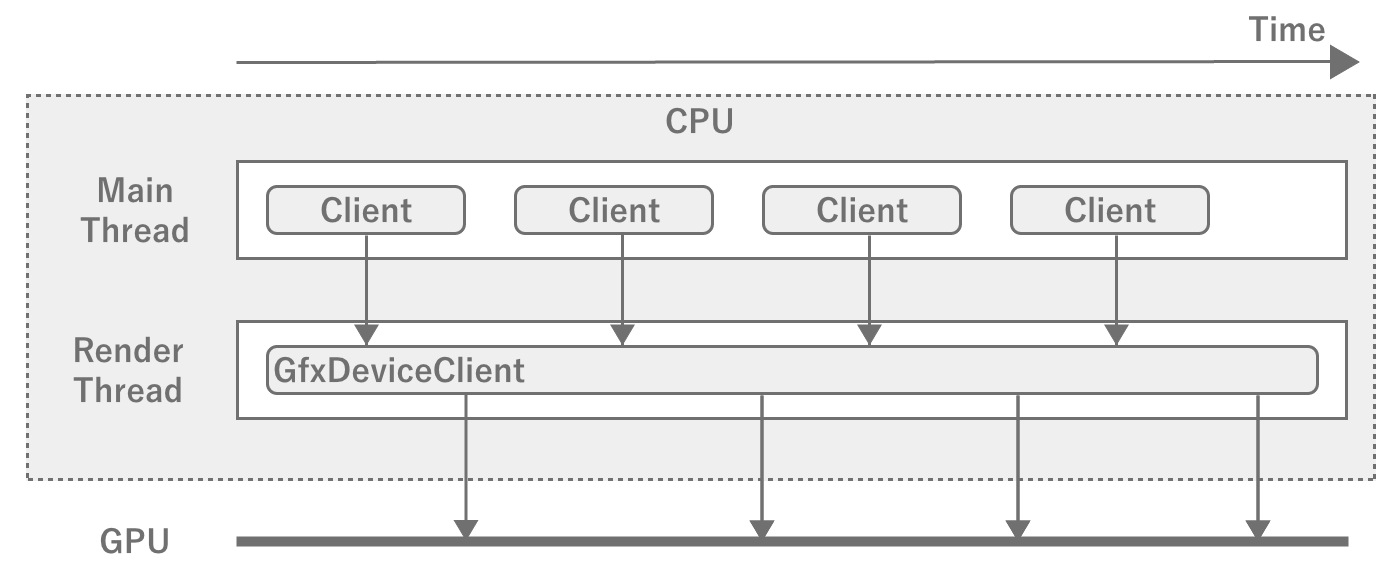
Figure 2.32: Main Thread and Render Thread
The main thread and the render thread run like a pipeline, so therender thread starts computing the next frame while the render thread is processing it.However, if the time to process a frame in the render thread is getting longer,it will not be able to start drawing the next frame even if the calculation for the next frame is finished, andthe main thread will have to wait.In game development, be aware that the FPS will drop if either the main thread or the render thread becomes too heavy.
Parallelizable User Processing Threading
In addition, there are many calculation tasks that can be executed in parallel, such as physics engine and shaking, which are unique to games.In order to execute such calculations outside of the main thread, Unity uses the Worker Thread (Worker Thread) exists to execute such calculations outside of the main thread.Worker threads execute computation tasks generated through the JobSystem.If you can reduce the processing load on the main thread by using JobSystem, you should actively use it.Of course, you can also generate your own threads without using JobSystem.
While threads are useful for performance tuning, we recommend that you do not use them in the dark, since there is a risk that using too many of them may conversely degrade performance and increase the complexity ofprocessing.
2.4.4. Game Loop
Common game engines, including Unity, use the Game Loop (Player Loop) which is a routine process of the engine.A simple way to describe the loop is roughly as follows
- Processing input from controllers such as keyboard, mouse, touch display, etc.
- Calculating the game state that should progress in one frame of time
- Rendering the new game state
- Waiting until the next frame depending on the target FPS
This loop is repeated to output the game as a video to the GPU.If processing within a single frame takes longer, then of course the FPS will drop.
Game Loop in Unity
The game loop in Unity is illustrated in the official Unity reference *4, which you may have seen at least once.
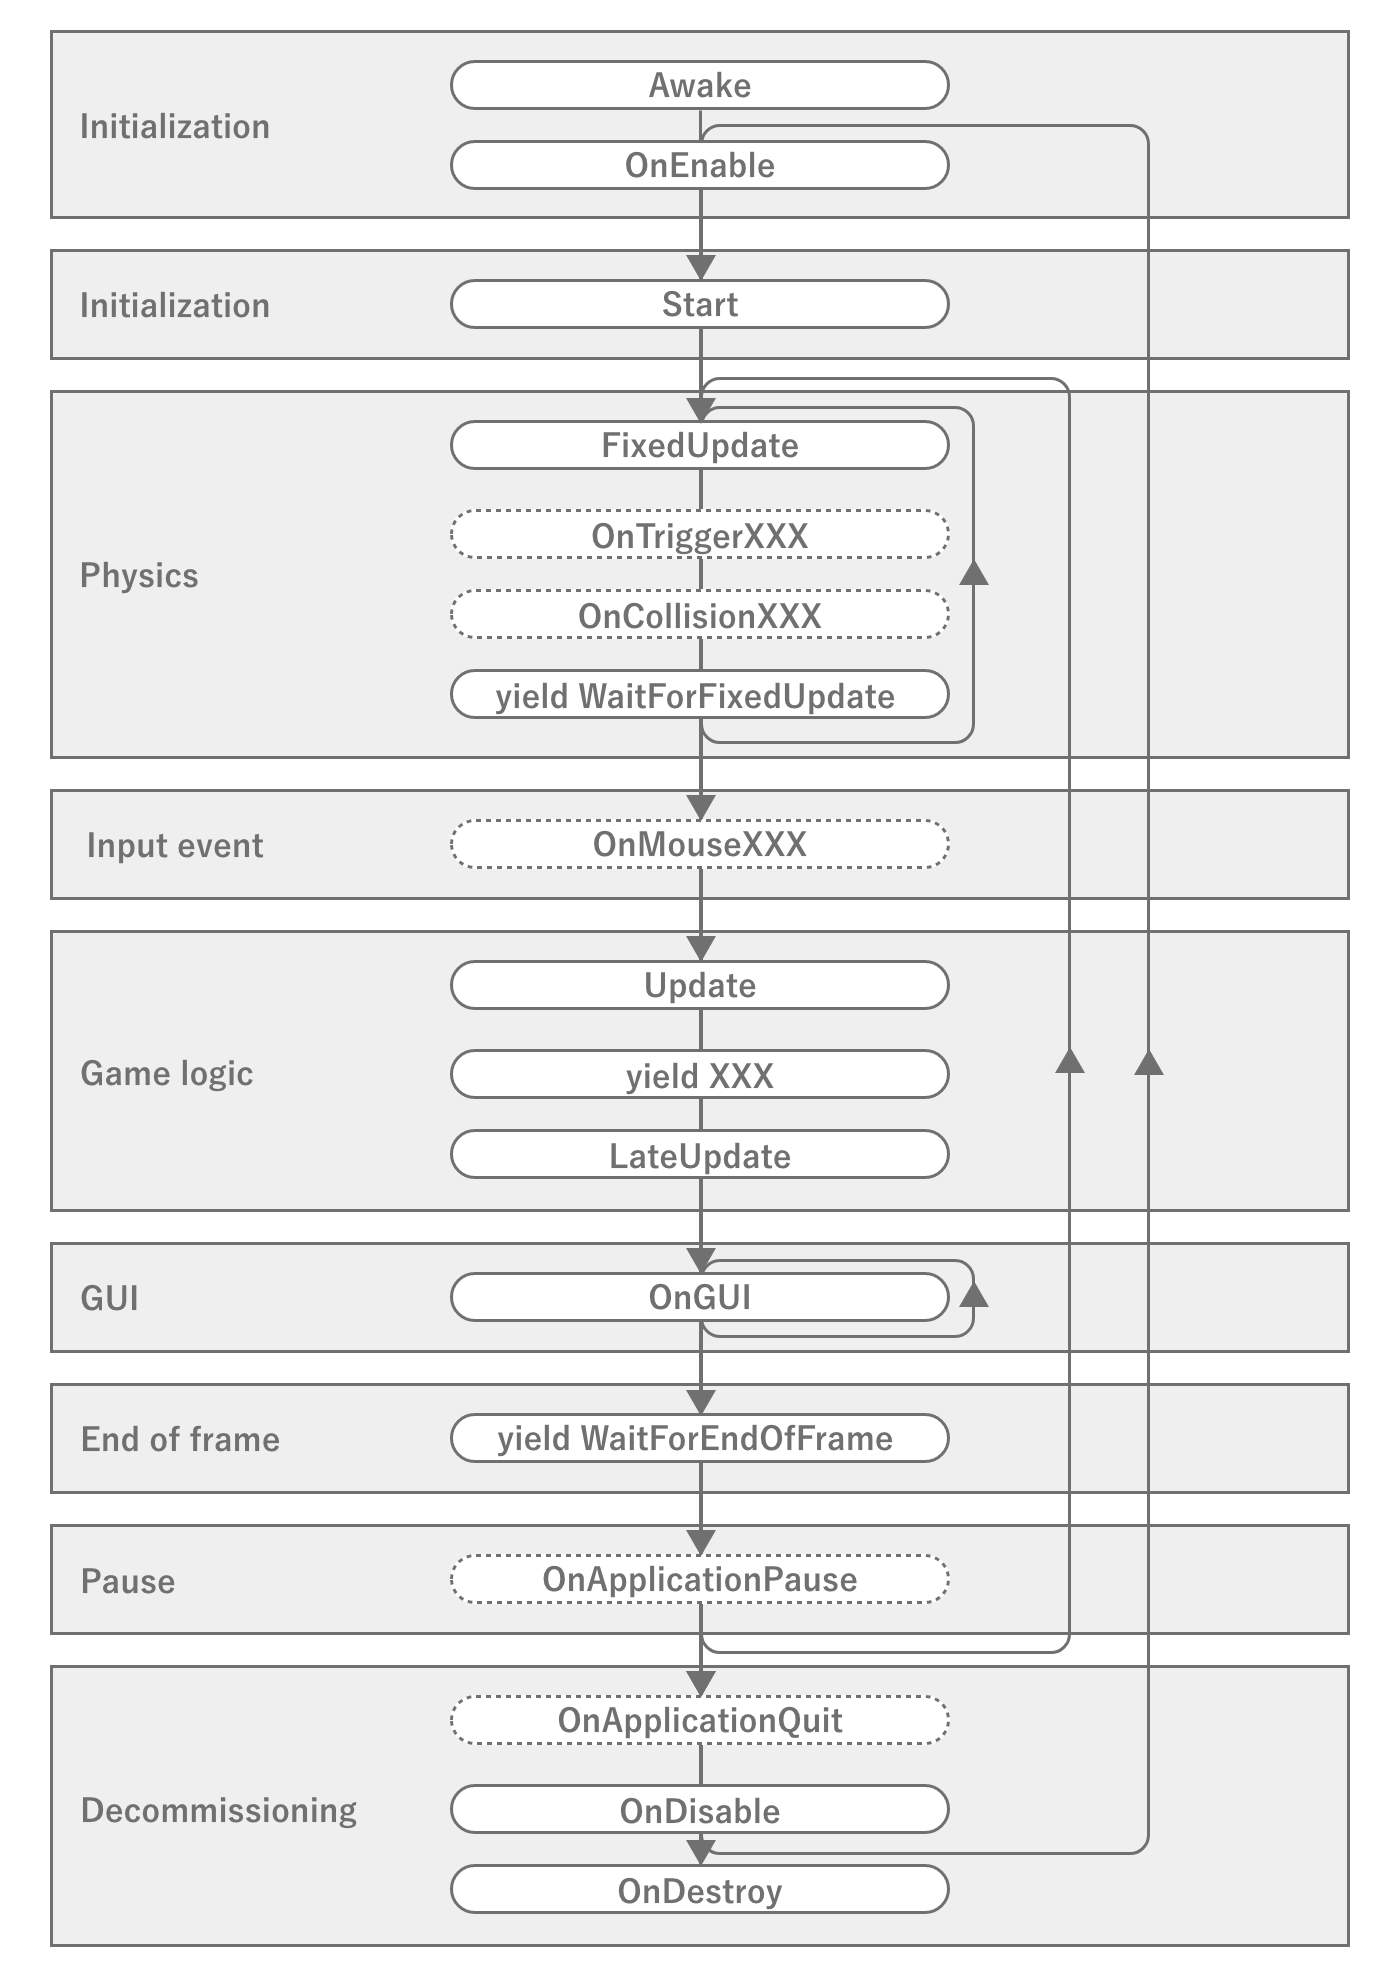
Figure 2.33: Event Execution Order in Unity
This diagram strictly shows the order of execution of events in MonoBehaviour, which is different from the game engine game loop *5, butis sufficient for a game loop that developers should know.Especially important are the events Awake, OnEnable, Start, FixedUpdate, Update, LateUpdate, OnDisable, OnDestroy and the timing of the various coroutines.Mistaking the order of execution or timing of events can lead to unexpected memory leaks or extra calculations.Therefore, you should be aware of the nature of important event call timing and the order of execution within the same event.
There are some specific problems with physics calculations, such as objects slipping through without being detected as collisions if they are executed at the same intervals as in the normal game loop.For this reason, the physics routines are usually looped at different intervals from the game loop so that they are executed at a high frequency.However, if the loops are run at a very fast interval, there is a possibility that they will conflict with the update process of the main game loop, so it is necessary to synchronize the processes to a certain extent.Therefore, be aware of the possibility that the physics operations may affect the frame drawing process if the physics operations are heavier than necessary, or that the physics operations may be delayed and slip through if the frame drawing process is heavier.
2.4.5. GameObject
As mentioned above, since the Unity engine itself runs natively, the Unity API in C# is also, for the most part, an interface for calling the internal native API.The same is true for GameObject and MonoBehaviour, which defines components that attach to it, which will always have native references from the C# side.However, if the native side manages the data and also has references to them on the C# side, there is an inconvenience when it comes time to destroy them.This is because the references from C# cannot be deleted without permission when the data is destroyed on the native side.
In fact, List 2.1 checks if the destroyed GameObject is null, but true is output in the log.This is unnatural for standard C# behavior, since _gameObject is not assigned null, so there should still be a reference to an instance of type GameObject.
List 2.1: Post-destruction reference test
public class DestroyTest : UnityEngine.MonoBehaviour
{
    private UnityEngine.GameObject _gameObject;

    private void Start()
    {
        _gameObject = new UnityEngine.GameObject("test");
        StartCoroutine(DelayedDestroy());
    }

    System.Collections.IEnumerator DelayedDestroy()
    {
        //  cache WaitForSeconds to reuse
        var waitOneSecond = new UnityEngine.WaitForSeconds(1f);
        yield return waitOneSecond;

        Destroy(_gameObject);
        yield return waitOneSecond;

        //  _gameObject is not null, but result is true
        UnityEngine.Debug.Log(_gameObject == null);
    }
}
This is because Unity's C# side mechanism controls access to destroyed data.In fact, if you refer to the source code *6 of UnityEngine.Object in Unity's C# implementation section, you will see the following
List 2.2: UnityEngine.Object's == operator implementation
        //  Excerpt.
        public static bool operator==(Object x, Object y) {
            return CompareBaseObjects(x, y);
        }

        static bool CompareBaseObjects(UnityEngine.Object lhs,
            UnityEngine.Object rhs)
        {
            bool lhsNull = ((object)lhs) == null;
            bool rhsNull = ((object)rhs) == null;

            if (rhsNull && lhsNull) return true;

            if (rhsNull) return !IsNativeObjectAlive(lhs);
            if (lhsNull) return !IsNativeObjectAlive(rhs);

            return lhs.m_InstanceID == rhs.m_InstanceID;
        }

        static bool IsNativeObjectAlive(UnityEngine.Object o)
        {
            if (o.GetCachedPtr() != IntPtr.Zero)
                return true;

            if (o is MonoBehaviour || o is ScriptableObject)
                return false;

            return DoesObjectWithInstanceIDExist(o.GetInstanceID());
        }
To summarize, a null comparison to a destroyed instance is true because when a null comparison is made, the native side is checked to see if the data exists.This causes instances of GameObject that are not null to behave as if they are partially null.While this characteristic is convenient at first glance, it also has a very troubling aspect.That is because _gameObject is not actually null, which causes a memory leak.A memory leak for a single _gameObject is obvious, but if you have a reference to a huge piece of data, for example a master, from within that component, it will lead to a huge memory leak because the reference remains asC# and is not subject to garbage collection.To avoid this, you need to take measures such as assigning null to _gameObject.
2.4.6. AssetBundle
Games for smartphones are limited by the size of the app, and not all assets can be included in the app.Therefore, in order to download assets as needed, Unity has a mechanism called AssetBundle that packs multiple assets and loads them dynamically.At first glance, this may seem easy to handle, but in a large project, it requires careful design and a good understanding ofmemory and AssetBundle, as memory can be wasted in unexpected places if not designed properly.Therefore, this section describes what you need to know about AssetBundle from a tuning perspective.
Compression settings for AssetBundle
AssetBundle is LZMA compressed by default at build time.This can be changed to uncompressed by changing BuildAssetBundleOptions to UncompressedAssetBundle and to LZ4 compression by changingto ChunkBasedCompression.The difference between these settings tends to look like the following Table 2.4
Table 2.4: Differences between AssetBundle compression settings
| Item | Uncompressed | LZMA | LZ4 |
|---|---|---|---|
| File size | extra large | Extra Small | small |
| Load Time | fast | slow | Fairly fast |
In other words, uncompressed is good for the fastest loading time, but its fatally large file size makes it basically unusable to avoid wasting storage space on smartphones.LZMA, on the other hand, has the smallest file size, but has the disadvantages of slow decompression and partial decompression due to algorithm problems.LZ4 is a compression setting that offers a good balance between speed and file size, and as the name ChunkBasedCompression suggests, partial decompression is possible, so partial loading is possible without having to decompress the entire file as with LZMA.
AssetBundle also has Caching.compressionEnabled, which changes the compression settings when cached in the terminal cache.In other words, by using LZMA for delivery and converting to LZ4 on the terminal, the download size can be minimized and the benefits of LZ4 can be enjoyed when actually used.However, recompression on the terminal side means that the CPU processing cost on the terminal is that much higher, and memory and storage space are temporarily wasted.
AssetBundle Dependencies and Duplication
If an asset is dependent on multiple assets, care must be taken when converting it to an AssetBundle.For example, if material A and material B depend on texture C, and you create an AssetBundle for material A and B without creating an AssetBundle for the texture, the two AssetBundles generated bywill each contain texture C, which will result in duplication and waste. This would be wasteful in terms of space usage.Of course, this is wasteful in terms of space usage, but it also wastes memory because the textures are instantiated separately when the two materials are loaded into memory.
To avoid having the same asset in multiple AssetBundles, texture C should be a standalone AssetBundle that is dependent on the material's AssetBundle, orMaterial A, B and texture C in a single AssetBundle. Material A, B and texture C must be made into a single AssetBundle.
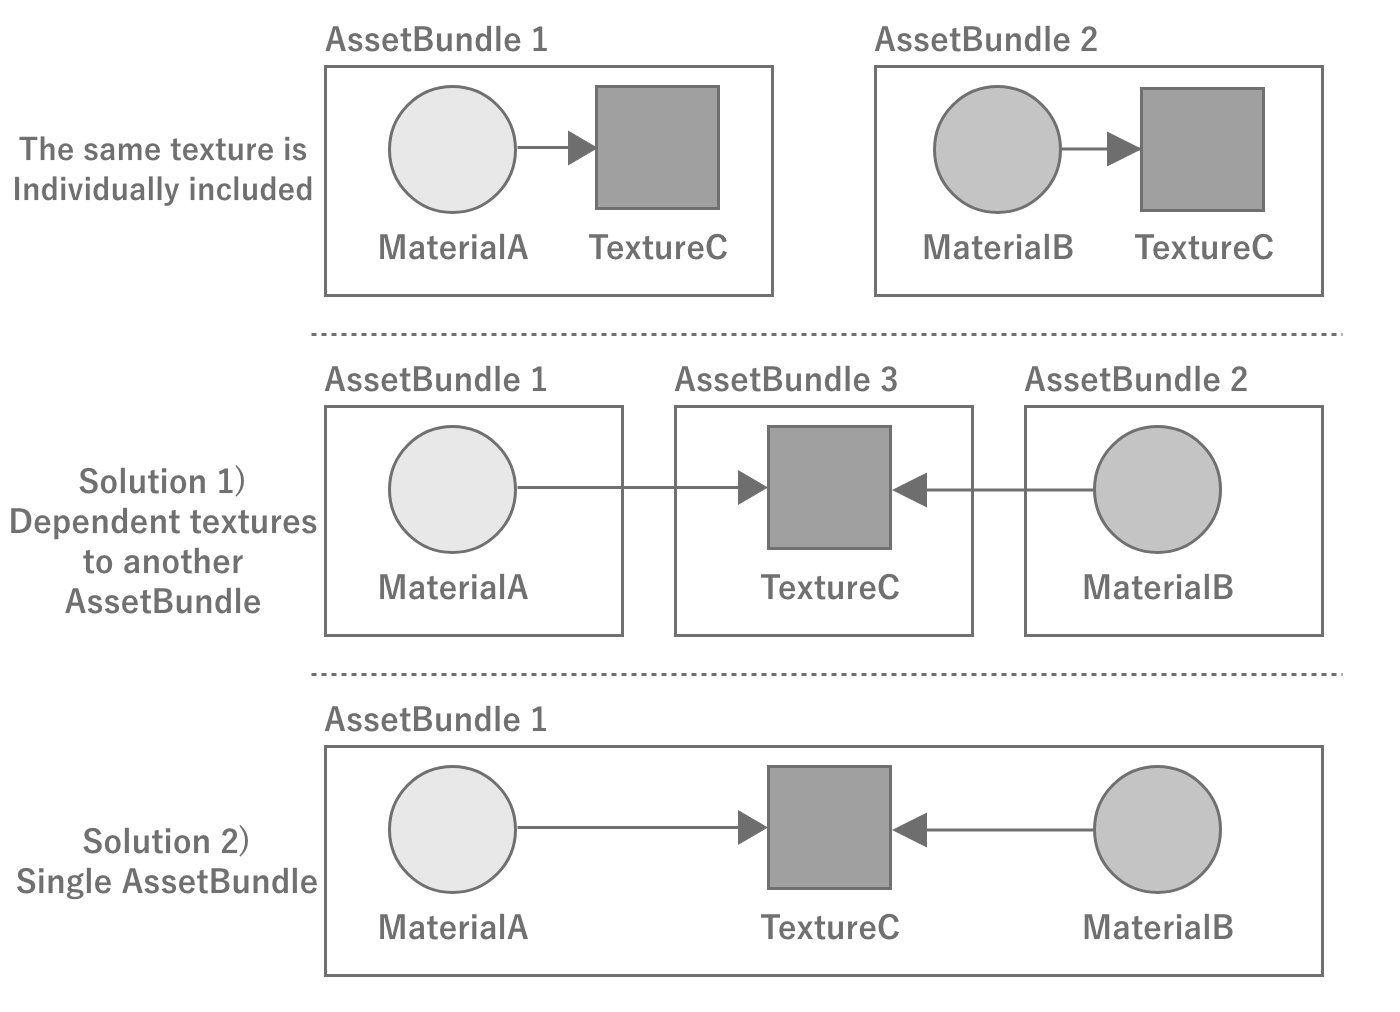
Figure 2.34: Example with AssetBundle dependencies
Identity of assets loaded from AssetBundle
An important property of loading assets from an AssetBundle is that as long as the AssetBundle is loaded, the same instance of the same asset will be returned no matter how many times the asset is loaded.This indicates that Unity internally manages the loaded assets, and the AssetBundle and the assets are tied together within Unity.By using this property, it is possible to leave the caching of assets to Unity without creating a cache mechanism for them on the game side.
Note, however, that an asset unloaded at AssetBundle.Unload(false) will become a different instance even if the same asset is loaded again from the same AssetBundle as at Figure 2.35.This is because the AssetBundle is unlinked from the asset at the time of unloading, and the management of the asset is in a state of floating in the air.
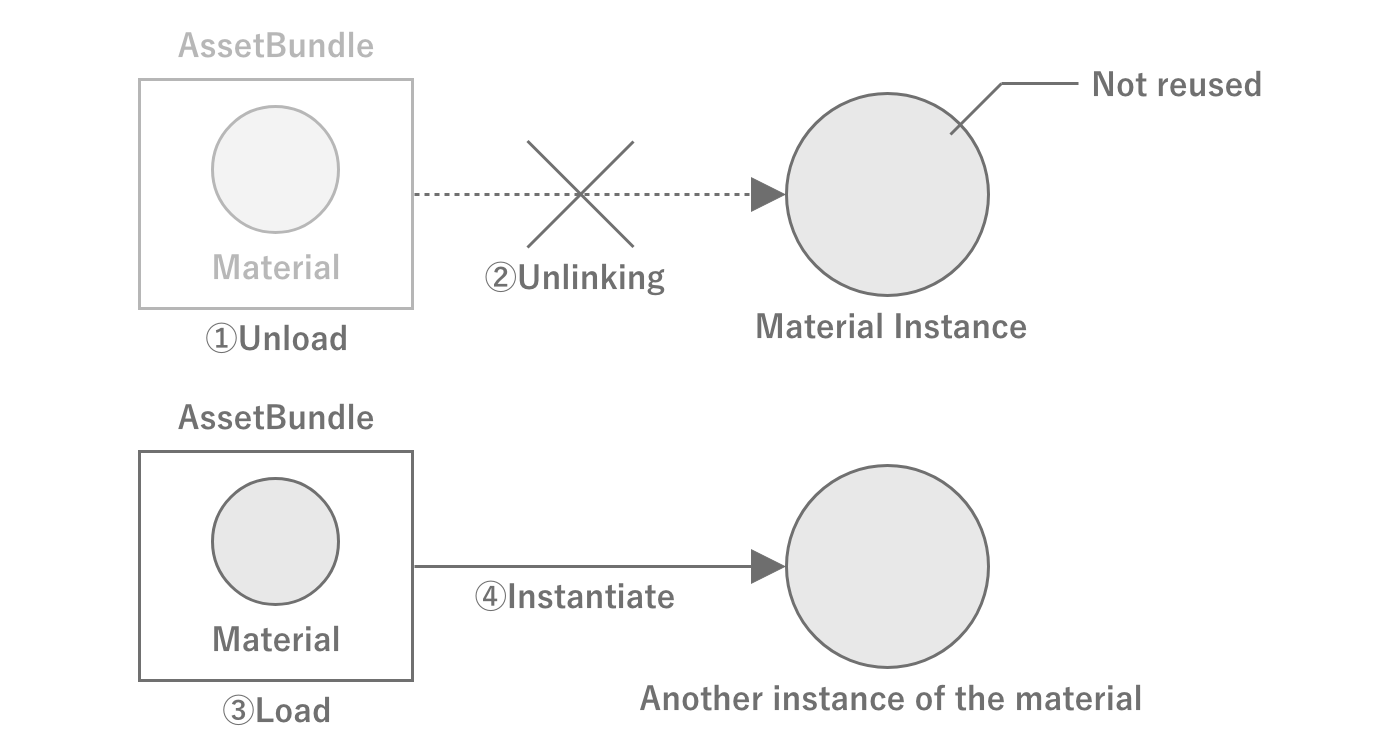
Figure 2.35: Example of memory leakage due to improper management of AssetBundle and assets
Destroying assets loaded from AssetBundle
When unloading AssetBundle using AssetBundle.Unload(true), the loaded assets are completely discarded, so there is no memory problem. However, when usingAssetBundle.Unload(false) , the assets are not discarded unless the asset unload instruction is called at the appropriate time.Therefore, when using the latter, it is necessary to call Resources.UnloadUnusedAssets appropriately so that assets are destroyed when switching scenes, etc.Also note that, as the name Resources.UnloadUnusedAssets implies, if a reference remains, it will not be released.Note that when Addressable is used, AssetBundle.Unload(true) is called internally.
2.5. C# Basics
This section describes the language specification and program execution behavior of C#, which is essential for performance tuning.
2.5.1. Stack and Heap
"Stack and Heap" introduced the existence of stack and heap as memory management methods during program execution.The stack is managed by the OS, while the heap is managed by the program.In other words, knowing how heap memory is managed allows for memory-aware implementation.Since the mechanism for managing heap memory depends largely on the language specification of the source code from which the program originates, we will explain heap memory management in C#.
Heap memory is allocated when necessary and must be released when it is finished being used.If memory is not released, a memory leak occurs and the memory area used by the application expands, eventually leading to a crash.C#, however, does not have an explicit memory release process.NET runtime environment in which C# programs are executed, heap memory is automatically managed by the runtime, and memory that has been used up is released at the appropriate time.For this reason, heap memory is referred to as Managed Heap is also referred to as managed heap memory.
The memory allocated on the stack matches the lifetime of the function, so it only needs to be released at the end of the function.heap memory allocated on the heap will most likely survive beyond the lifetime of the function, meaning that heap memory is used only when the function finishes using it.This means that heap memory is needed and used at different times, so a mechanism is needed to use heap memory automatically and efficiently.The details are presented in the next section. Garbage Collection Garbage Collection
In fact, Unity's Alloc is a proprietary term that refers to the memory allocated to the heap memory managed by garbage collection.Therefore, reducing GC.Alloc will reduce the amount of heap memory allocated dynamically.
2.5.2. Garbage Collection
In C# memory management, the search and release of unused memory is called garbage collection, or "GC" for short.The garbage collector is executed cyclically. However, the exact timing of execution depends on the algorithm.It performs a simultaneous search of all objects on the heap and deletes all objects that are already dereferenced.In other words, dereferenced objects are deleted, freeing up memory space.
There are various algorithms for garbage collectors, but Unity uses the Boehm GC algorithm by default.The Boehm GC algorithm is characterized by being "non-generational" and "uncompressible.Non-generation-specific" means that the entire heap has to be scanned at once for each garbage collection run.This reduces performance because the search area expands as the heap expands.Uncompressed" means that objects are not moved in memory to close gaps between objects.This means that fragmentation, which creates small gaps in memory, tends to occur and the managed heap tends to expand.
Each is a computationally expensive and synchronous process that stops all other processing, leading to the so-called "Stop the World" process drop when running during agame.
Starting with Unity 2018.3, GCMode can be specified and can be temporarily disabled.
List 2.3:
GarbageCollector.GCMode = GarbageCollector.Mode.Disabled; |
But of course, if GC.Alloc is done during the period of disabling, the heap space will be extended and consumed,eventually leading to a crash of the app as it cannot be newly allocated. Since memory usage can easily increase,it is necessary to implement the function so that GC.Alloc is not performed at all during the period when it is disabled, andthe implementation cost is also high, so the actual use is limited.(e.g., disabling only the shooting part of a shooting game)
In addition, Incremental GC can be selected starting with Unity 2019.With Incremental GC, garbage collection processing is now performed across frames, and large spikes can now be reduced.However, for games that must maximize power while reducing processing time per frame,it is necessary to implement an implementation that avoids the occurrence of GC.Alloc when it comes down to it.Specific examples are discussed at "10.1 GC.Alloc cases and how to deal with them".
When should we start working on this?
Because of the large amount of code in a game, if performance tuning is performed after the implementation of all functions is complete,you will often encounter designs/implementations that do not avoid GC.Alloc.If you are always aware of where it occurs from the initial design stage before coding,the cost of rework can be reduced, and total development efficiency tends to improve.
The ideal implementation flow is to first create a prototype with an emphasis on speed to verify the feel and the core of the game.Then, when moving on to the next phase of production, the design is reviewed and restructured once again. During this restructuring phase, it would be healthy to work on eliminatingGC.Alloc. In some cases, it may be necessary to reduce the readability of the code in order to speed up the process, so if we start from theprototype, the development speed will also decrease.
2.5.3. Structure (struct)
In C#, there are two types of composite type definitions: classes and structs. The basic premise is that classes are reference types and structs are value types.Citing MSDN's "Choosing Between Class and Struct" *7, we will review the characteristics of each, the criteria by which they should be chosen, and notes on their usage.
[*7] https://docs.microsoft.com/en-us/dotnet/standard/design-guidelines/choosing-between-class-and-struct
Differences in Memory Allocation Locations
The first difference between reference and value types is that they allocate memory differently. Although somewhat imprecise, it is safe to recognize the following.Reference types are allocated in the heap area of memory and are subject to garbage collection.Value types are allocated in the stack area of memory and are not subject to garbage collection.Allocation and deallocation of value types is generally less expensive than for reference types.
However, value types and static variables declared in fields of reference types are allocated in the heap area.Note that variables defined as structures are not necessarily allocated to the stack area.
Handling Arrays
Arrays of value types are allocated inline, and the array elements are the entities (instances) of the value type.On the other hand, in an array of reference type, the array elements are arranged by reference (address) to the entity of the reference type.Therefore, allocation and deallocation of arrays of value types is much less expensive than for reference types.In addition, in most cases, arrays of value types have the advantage that the locality (spatial locality) of references is greatly improved, which makesCPU cache memory hit probability higher and facilitates faster processing.
Value Copying
In reference-type assignment (allocation), the reference (address) is copied. On the other hand, in a value type assignment (allocation), the entire value is copied.The size of the address is 4 bytes in a 32-bit environment and 8 bytes in a 64-bit environment.Therefore, a large reference type assignment is less expensive than a value type assignment that is larger than the address size.
Also, in terms of data exchange (arguments and return values) using methods, the reference type passes the reference (address) by value, whereas thevalue type passes the instance itself by value.
List 2.4:
private void HogeMethod(MyStruct myStruct, MyClass myClass){...} |
For example, in this method, the entire value of MyStruct is copied. This means that as the size of MyStruct increases, so does the copy cost.On the other hand, the MyClass method only copies the reference to myClass as a value, so even if the size of MyClass increases, thecopy cost will remain constant because it is only for the address size. Since the increase in copy cost is directly related to the processing load, the appropriate choice must be made according to the size of the data to be handled.
Immutability
Changes made to an instance of a reference type will affect other locations that reference the same instance.On the other hand, a copy of an instance of a value type is created when it is passed by value. If an instance of a value type is modified,naturally does not affect the copy of that instance. The copy is not created explicitly by the programmer, but implicitly when theargument is passed or the return value is returned.As a programmer, you have probably experienced the bug at least once where you thought you were changing a value, but in fact you were just setting the value against the copy, which is not whatwas intended to do.It is recommended that value types be immutable, as changeable value types can be confusing to many programmers.
Pass-by-Reference
A common misapplication is that "reference types are always passed by reference," but as mentioned earlier, reference (address) copying is fundamental, andreference passing is done when the ref/in/out parameter modifier is used.
List 2.5:
private void HogeMethod(ref MyClass myClass){...} |
Since the reference (address) was copied in reference type value passing, replacing an instance does not affect the original instance, butreference passing allows replacing the original instance.
List 2.6:
private void HogeMethod(ref MyClass myClass) { // The original instance passed by argument is rewritten. myClass = new MyClass(); } |
Boxing
Boxing is the process of converting a value type to a object type or a value type to an interface type.A box is an object that is allocated on the heap and subject to garbage collection.Therefore, an excess of boxing and unboxing will result in GC.Alloc. In contrast, when a reference type is cast,no such boxings take place.
List 2.7: When a value type is cast to an object type, boxed
int num = 0; object obj = num; // Boxed num = (int) obj; // Unboxing |
We would never use such obvious and meaningless boxings, but what about when they are used in themethod?
List 2.8: Example of boxed by implicit cast
private void HogeMethod(object data){ ... } // Abbreviation int num = 0; HogeMethod(num); // Boxing with arguments |
Cases like this exist where boxings are unintentionally boxed.
Compared to simple assignment, boxing and unboxing is a burdensome process.When boxed value types are boxed, new instances must be allocated and constructed.Also, although not as burdensome as boxing, the casting required for unboxing is also very burdensome.
Criteria for Selecting Classes and Structures
- Conditions under which structures should be considered :
- When instances of the type are often small and have a short validity period
- When the type is often embedded in other objects
- Conditions for avoiding structures: unless the type has all of the following characteristics
- When it logically represents a single value, as with primitive types (
int,double, etc.) - The size of the instance is less than 16 bytes
- It is immutable.
- Does not need to be boxed frequently
- When it logically represents a single value, as with primitive types (
There are a number of types that do not meet the above selection criteria but are defined as structures.Types such as Vector4 and Quaternion, which are frequently used in Unity, are defined as structs, though not less than 16 bytes.Please check how to handle these efficiently, and if copying costs are increasing, choose a method that includes a workaround.In some cases, consider creating an optimized version with equivalent functionality on your own.
2.6. Algorithms and computational complexity
Game programming uses a variety of algorithms.Depending on how the algorithm is created, the calculation result may be the same, but the performance may vary greatly due to differences in the calculation process.For example, you will want a metric to evaluate how efficient the standard C# algorithm is andhow efficient your implementation of the algorithm is, respectively.As a guide to measure these, a measure called computational complexity is used.
2.6.1. About computational complexity
The computational complexity is a measure of an algorithm's computational efficiency, and can be subdivided into time complexity, which measures time efficiency, and area complexity, which measures memory efficiency.The order of computational complexity isO notation (Landau's symbol). Since computer science and mathematical definitions are not the essence here, please refer to other books if you are interested.In this paper, the quantity of calculations is treated as time-calculated quantities.
The main commonly used computational quantities areO(1) O(1), O(2), O(3), O(4)O(n) andO(n^2) , O(n^2)O(n\log n) are denoted as In parenthesesn in parentheses indicates the number of data.It is easy to understand if you imagine how much the number of times a certain process is processed depends on the number of data. To compare performance in terms of computational complexity, seeO(1) < O(\log n) < O(n) < O(n\log n) < O(n^2) < O(n^3) The result is as follows.Table 2.5 The comparison of the number of data and the number of calculation steps and the comparison graph displayed logarithmically at Figure 2.36 are shown in the following table.O(1) is excluded because it does not depend on the number of data and is obviously more efficient than O(1). For example, forO(\log n) has 13 computation steps even if there are 10,000 samples, andhas 23 computation steps even if there are 10 million samples, which shows that it is extremely superior.
Table 2.5: Number of data and number of computation steps for major quantities
| n | O(\log n) | O(n) | O(n\log n) | O(n^2) | O(n^3) |
|---|---|---|---|---|---|
| 10 | 3 | 10 | 33 | 100 | 1,000 |
| 100 | 7 | 100 | 664 | 10,000 | 1,000,000 |
| 1,000,000 | 10 | 1,000 | 9,966 | 1,000,000 | 1,000,000,000 |
| 10,000 | 13 | 10,000 | 132,877 | 100,000,000 | 1,000,000,000 1,000,000,000 |
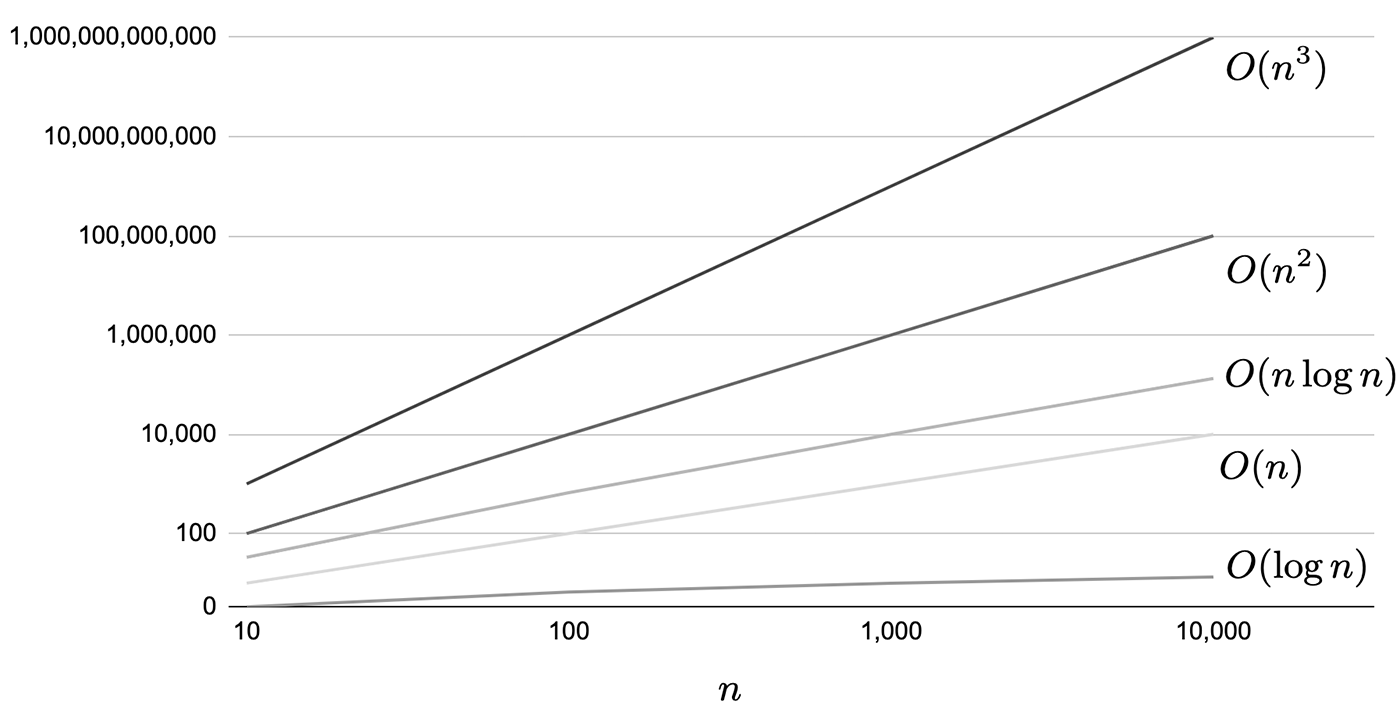
Figure 2.36: Comparison of performance differences in logarithmic representation of each calculation amount
To illustrate each of the computational quantities, we will list a few code samples. First, let's look at the following code samplesO(1) indicates a constant amount of computation independent of the number of data.
List 2.9: Code example of O(1) Code example of O(1)
private int GetValue(int[] array) { // Assume that array is an array containing some integer value. var value = array[0]; return value; } |
Aside from the raison d'etre of this method, obviously the process is independent of the number of data in the array and takes a constant number of calculations (in this case, one).
Next, we callO(n) code example.
List 2.10: O(n) Code Example of O(n)
private bool HasOne(int[] array, int n) { // Assume that array has length=n and contains some integer value for (var i = 0; i < n; ++i) { var value = array[i]; if (value == 1) { return true; } } } |
Here is an array containing integer values with1 is present, the process just returns true. If by chance the first of array1 is found at the beginning of, the process may be completed in the fastest possible time, but if there is no 1 in array , the process will return1 or at the end of array for the first time, the process will return1 is found for the first time at the end of , the loop will go all the way to the end, son times because the loop goes all the way to the end.This worst-case scenario is calledO(n) and you can imagine that the amount of computation increases with the number of data.
Next, let us denote the worst-case scenario asO(n^2) Let's look at an example for the case of O(n^2).
List 2.11: O(n^2) Example code for
private bool HasSameValue(int[] array1, int[] array2, int n) { // Assume array1 and array2 have length=n and contain some integer value. for (var i = 0; i < n; ++i) { var value1 = array1[i]; for (var j = 0; j < n; ++j) { var value2 = array2[j]; if (value1 == value2) { return true; } } } return false; } |
This one is just a method that returns true if any of the two arrays contain the same value in a double loop.The worst-case scenario is that they are all mismatched cases, son^2 times.
As a side note, in the concept of computational complexity, only the term with the largest order is used. If we create a method that executes each of the three methods in the above example once, we getthe maximum orderO(n^2) of the maximum order. (TheO(n^2+n+1) )
It should also be noted that the calculation volume is only a guideline when the number of data is sufficiently large, and is not necessarily linked to the actual measurement time.O(n^5) may not be a problem when the number of data is small, even if it looks like a huge calculation volume such as. Therefore, it is recommended to use the calculation volume as a reference and measure the processing time to see if it fits within a reasonable range, taking the number of data into consideration each time.
2.6.2. Basic Collections and Data Structures
C# provides collection classes with various data structures.This section introduces the most frequently used ones as examples, and shows in what situations you should employ each of them, based on the computation time of the main methods.
The method complexity of the collection classes described here can be found on MSDN at. It is safer to check the MSDN when selecting the most appropriate collection class.
List<T>
This is the most commonly used List<T>. The data structure is an array.It is effective when the order of data is important, or when data is often retrieved or updated by index.On the other hand, if there are many insertions and deletions of elements, it is best to avoid usingList<T> because it requires a large amount of computation due to the need to copy after the indexes that have been manipulated.
In addition, when the capacity is exceeded by Add, the memory allocated for the array is extended.When memory is extended, twice the current Capacity is allocated, so it is recommended that Add be used withO(1)to use it with appropriate initial values so that it can be used without causing expansion.
Table 2.6: List<T>
| Method | Calculation |
|---|---|
| Add | O(1) However, if capacity is exceededO(n) |
| Insert | O(n) |
| IndexOf/Contains | O(n) |
| RemoveAt | O(n) |
| Sort | O(n\log n) |
LinkedList<T>
The data structure of LinkedList<T> is a linked list. A linked list is a basic data structure, in which each node has a reference to the next node.C#'s LinkedList<T> is a two-way linked list, so each has a reference to the node before and after it. LinkedList<T> has strong features for adding and deleting elements, but is not good at accessing specific elements in thearray. It is suitable when you want to create a process that temporarily holds data that needs to be added or deleted frequently.
Table 2.7: LinkedList<T>
| Method | Computation |
|---|---|
| AddFirst/AddLast | O(1) |
| AddAfter/AddBefore | O(1) |
| Remove/RemoveFirst/RemoveLast | O(1) |
| Contains | O(n) |
Queue<T>
Queue<T> is a collection class that implements the FIFO (first in first out) method.It is used to implement so-called queues, for example, to manage input operations.In Queue<T>, a circular array is used. Enqueue The first element is added at the end with Dequeue and the first element is removed while the second element is removed with .When adding beyond capacity, expansion is performed. Peek is an operation to take out the top element without deleting it. As you can see from the computational complexity,Enqueue and Dequeue can be used to keephigh performance, but they are not suitable for operations such as traversal. TrimExcess is a method to reduce capacity, but from aperformance tuning perspective, it can be used so that capacity is not increased or decreased in the first place, further exploiting Queue<T> its strengths.
Table 2.8: Queue<T>
| Method | Compute capacity |
|---|---|
| Enqueue | O(1) However, if capacity is exceededO(n) |
| Dequeue | O(1) |
| Peek | O(1) |
| Contains | O(n) |
| TrimExcess | O(n) |
Stack<T>
Stack<T> is a collection class that implements the last in first out (LIFO) method: last in first out.Stack<T> is implemented as an array. Push The first element is added with Pop, and the first element is removed with .Peek is an operation to take out the first element without deleting it.A common use of is when implementing screen transitions, where the scene information for the destination of the transition is stored in Push, and when the back button is pressed, retrieving the scene information by Pop.As with Queue, high performance can be obtained by using only Push and Pop for Stack. Be careful not to search for elements, and be careful to increase or decrease capacity.
Table 2.9: Stack<T>
| Method | Compute capacity |
|---|---|
| Push | O(1) However, if capacity is exceededO(n) |
| Pop | O(1) |
| Peek | O(1) |
| Contains | O(n) |
| TrimExcess | O(n) |
Dictionary<TKey, TValue>
While the collections introduced so far have been semantic in order, Dictionary<TKey, TValue> is a collection class that specializes in indexability.The data structure is implemented as a hash table (a kind of associative array). The structure is like a dictionary where keys have corresponding values (in the case of a dictionary, words are keys and descriptions are values).Dictionary<TKey, TValue> has the disadvantage of consuming more memory, but the speed of the lookup isO(1) and faster.It is very useful for cases that do not require enumeration or traversal, and where the emphasis is on referencing values. Also, be sure to pre-set the capacity.
Table 2.10: Dictionary<TKey, TValue>
| Method | Compute Capacity |
|---|---|
| Add | O(1) However, if capacity is exceededO(n) |
| TryGetValue | O(1) |
| TryGetValue | O(1) |
| ContainsKey | O(1) |
| ContainsValue | O(n) |
2.6.3. Devices to Lower the Calculation Volume
In addition to the collections introduced so far, various others are available.Of course, it is possible to implement the same process using only List<T>(array), but by selecting a collection class more suitable for, it is possible to optimize the amount of computation.By simply implementing methods with an awareness of the amount of computation, heavy processing can be avoided.As a way to optimize your code, you may want to check the computational complexity of your methods and see if you can reduce it to less than.
Means of devising: memoization
Suppose you have a method ( ComplexMethod) with a very high computational complexity that requires complex calculations.However, there are times when it is not possible to reduce the amount of calculation.In such cases, a technique called memoization can be used.
Let us assume that ComplexMethod uniquely returns the corresponding result when given an argument.First, the first time the argument is passed, a complex process is passed through. After the calculation, the arguments and the result are put into Dictionary<TKey, TValue> and cached.The second and subsequent times, we first check to see if they are cached, and if they are, we return only the result and exit.In this way, no matter how high the computation volume may be the first time, the second and subsequent times the computation volume is reduced toO(1) the second time.If the number of arguments that can be passed is known in advance, it is possible to complete the calculation before the game and cache it, so thateffectively returnsO(1) and cache them before the game.