Chapter 1. Getting Started with Performance Tuning
This chapter describes the preparation required for performance tuning and the flow of the process.
First, we will cover what you need to decide on and consider before starting performance tuning.If your project is still in the early stages, please take a look at it.Even if your project is somewhat advanced, it is a good idea to check again to see if you have taken into account the information listed in this section.Next, we will explain how to address the application that is experiencing performance degradation.By learning how to isolate the cause of the problem and how to resolve it, you will be able to implement a series of performance tuning flows.
1.1. Preliminary Preparation
Before performance tuning, decide on the indicators you want to achieve. It is easy to say in words, but it is actually a highly challenging task.This is because the world is full of devices with various specifications, and it is impossible to ignore users with low-specification devices.Under such circumstances, it is necessary to consider various factors, such as game specifications, target user groups, and whether or not the game will be developed overseas.This work cannot be completed by engineers alone. It is necessary to determine quality lines in consultation with people in other professions, and technical verification will also be necessary.
It is highly difficult to determine these indicators from the initial phase when there are not enough function implementations or assets to measure the load.Therefore, one approach is to determine them after the project has progressed to a certain degree.However, it is important to make sure that the decision is made before the project enters the mass production phase.This is because once mass production is started, the cost of change will be enormous.It will take time to decide on the indicators introduced in this section, but do not be in a hurry and proceed firmly.
Fear of specification changes after the mass production phase
Suppose you have a project that is now in the post-production phase, but has a rendering bottleneck on a low-spec terminal.Memory usage is already near its limit, so switching to a lower-load model based on distance is not an option.Therefore, we decide to reduce the number of vertices in the model.
First, we will reorder the data for reduction. A new purchase order will be needed.Next, the director needs to check the quality again. And finally, we also need to debug.This is a simplified description, but in reality there will be more detailed operations and scheduling.
After mass production, there will be dozens to hundreds of assets that will need to be handled as described above.This is time-consuming and labor-intensive, and can be fatal to the project.
To prevent such a situation, it is very important to create the most burdensome scenes and verify in advance whether they meet the indicators.
1.1.1. Determining Indicators
Determining indicators will help you determine the goals to be achieved. On the other hand, if there are no indicators, the project will never end.Table 1.1 The following is a list of indicators that you should decide on.
Table 1.1: Indicators
| Item | Element |
|---|---|
| Frame rate | How much frame rate to aim for at all times. |
| Memory | Estimate the maximum memory on which screen and determine the limit value. |
| Transition time | How long is the appropriate transition time wait? |
| Heat | How much heat can be tolerated in X hours of continuous play |
| Battery | How much battery consumption is acceptable for X hours of continuous play |
Table 1.1Frame rate andmemory are the most important indicators among the above, so be sure to decide on them.At this point, let's leave low-specification devices out of the equation.First of all, it is important to determine the indicators for devices in the volume zone.
The definition of the volume zone depends on the project.You may want to decide based on market research or other titles that can be used as benchmarks.Or, given the background of prolonged replacement of mobile devices, you may use the mid-range of about four years ago as a benchmark for now.Even if the rationale is a bit vague, let's set a flag to aim for. From there, you can make adjustments.
Let us consider an actual example.Suppose you have a project with the following goals
- We want to improve everything that is wrong with our competitor's application.
- We want to make it run smoothly, especially ingame.
- Other than the above, we want to be as good as the competition.
When the team verbalized these vague goals, the following metrics were generated.
- Frame rate
- 60 frames ingame and 30 frames outgame from a battery consumption perspective.
- Memory
- To speed up the transition time, the design should retain some out-game resources during ingame. The maximum amount of memory used shall be 1 GB.
- Transition Time
- Transition time to ingame and outgame should be at the same level as the competition. In time, it should be within 3 seconds.
- Heat
- Same level as the competition. It does not get hot for 1 hour continuously on the verified device. (Not charging)
- Battery
- Same level as competitors. Battery consumption is about 20% after 1 hour of continuous use on the tested device.
Once you have determined the target, you can use a reference device to test it.If the target is not reached at all, it is a good indicator.
Optimization by game genre
In this case, the theme of the game was to run smoothly, so the frame rate was set at 60 frames per second.A high frame rate is also desirable for rhythm action games and games with severe judgments such as first-person shooters (FPS).However, there is a disadvantage to a high frame rate. The higher the frame rate, the more battery power is consumed.In addition, the more memory is used, the more likely it is to be killed by the OS when it suspends.Considering these advantages and disadvantages, decide on an appropriate target for each game genre.
1.1.2. Know the maximum amount of memory usage.
This section focuses on maximum memory usage.To determine the maximum memory usage, first determine how much memory is available on the supported devices.Basically, it is a good idea to verify this with the lowest specification device that is guaranteed to work.However, since the memory allocation mechanism may have changed depending on the OS version, it is recommended to prepare multiple devices with different major versions if possible.Also, since the measurement logic differs depending on the measurement tool, be sure to use only one tool.
For reference, the following is a description of the verification conducted by the author on iOS.In the verification project, Texture2D was generated at runtime, and the time required for a crash was measured.The code is as follows
List 1.1: Verification code
private List<Texture2D> _textureList = new List<Texture2D>(); ... public void CreateTexture(int size) { Texture2D texture = new Texture2D(size, size, TextureFormat.RGBA32, false); _textureList.Add(texture); } |
The result of the verification is as follows: Figure 1.1
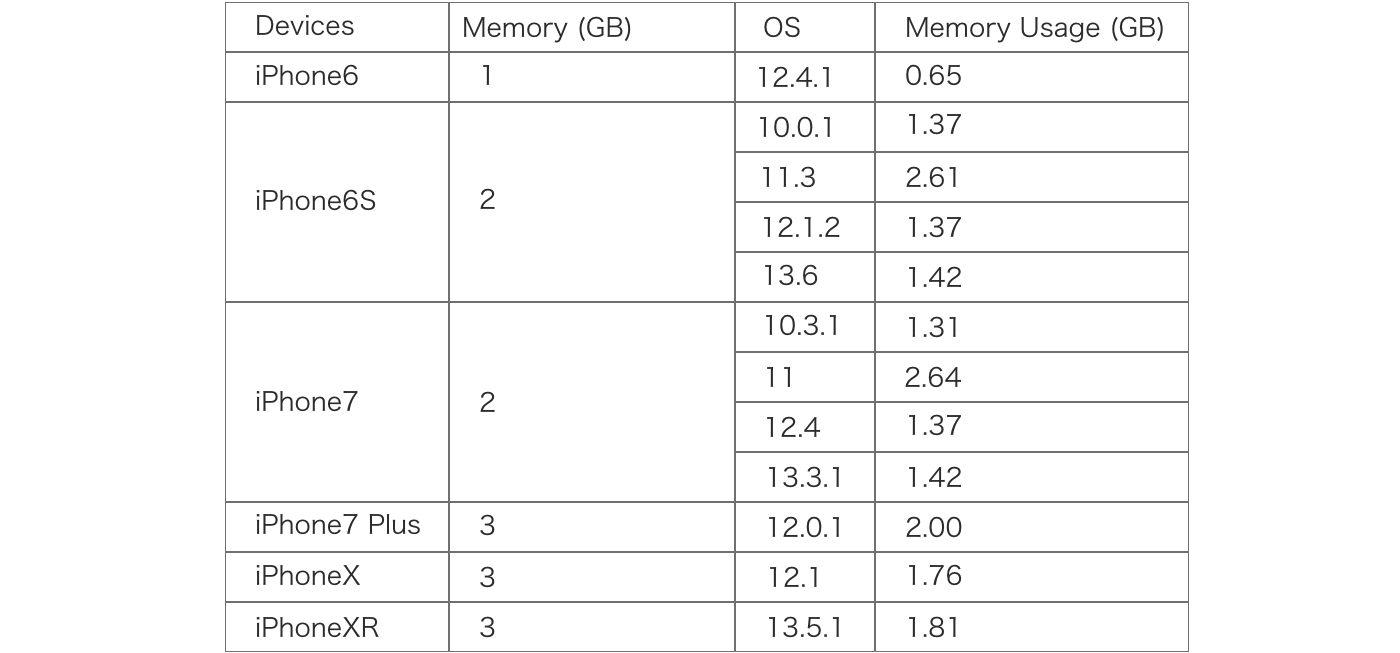
Figure 1.1: Crash Threshold.
The verification environment is Unity 2019.4.3 and Xcode 11.6, using the values in the Memory section of Xcode's Debug Navigator as reference.Based on the results of this verification, it is recommended to keep the memory within 1.3 GB for devices with 2 GB of onboard memory, such as the iPhone 6S and 7.It can also be seen that when supporting devices with 1GB of onboard memory, such as the iPhone 6, the memory usage constraints are much stricter.Another characteristic of iOS11 is that its memory usage is significantly higher than that of the iPhone 6, possibly due to a different memory management mechanism.When verifying, please note that such differences due to operating systems are rare.
Figure 1.1 In the following example, the test environment is a little old, so some of the measurements have been re-measured using the latest environment at the time of writing.We used Unity 2020.3.25 and 2021.2.0 and Xcode 13.3.1 to build on iPhoneXR with OS versions 14.6 and 15.4.1.As a result, there was no particular difference in the measured values, so I think the data is still reliable.
Memory measurement tools
We recommend native-compliant tools such as Xcode and AndroidStudio for memory measurement.For example, the Unity Profiler does not measure native memory allocated by plug-ins.In the case of IL2CPP builds, IL2CPP metadata (about 100MB) is also not included in the measurement.On the other hand, in the case of the native tool Xcode, all memory allocated by the application is measured.Therefore, it is better to use a native-compliant tool that measures values more accurately.
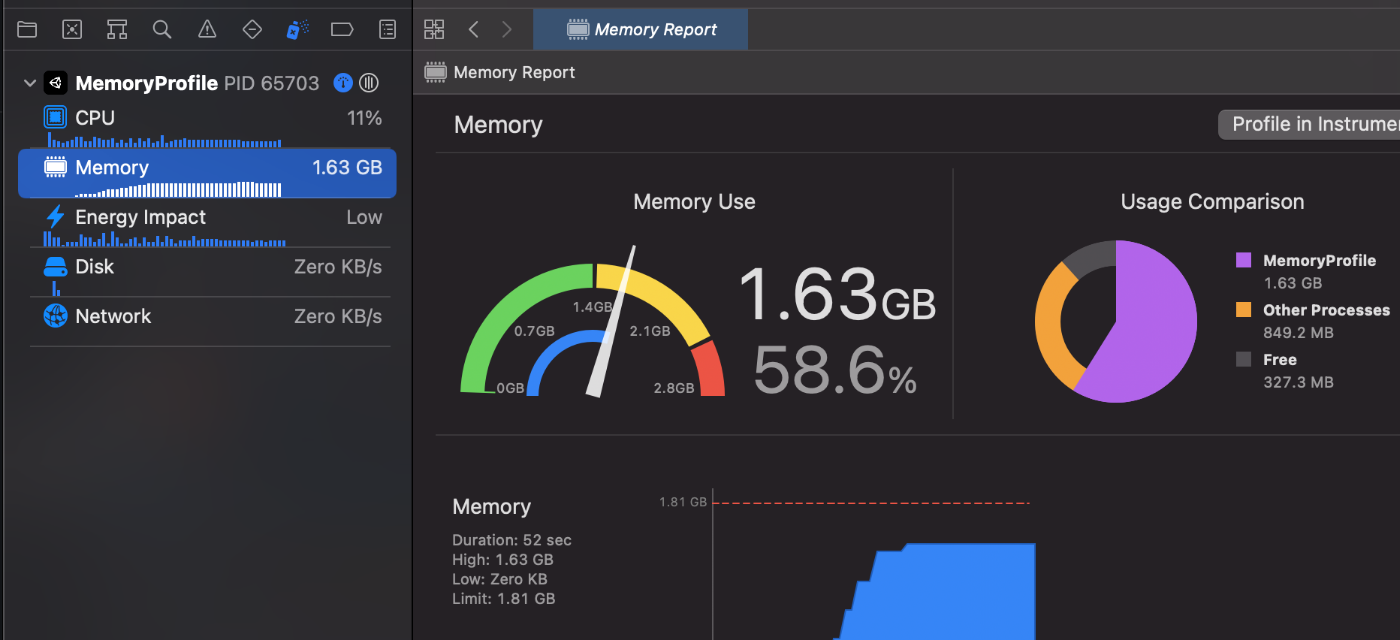
Figure 1.2: Xcode Debug Navigator
1.1.3. Decide which devices are guaranteed to work
It is also important to decide on the minimum guaranteed terminal as an indicator to determine how far to go in performance tuning.It is difficult to decide on a guaranteed device immediately without experience, but do not decide on a spur-of-the-moment basis, but rather start by identifying candidates for low-specification devices.
The method I recommend is to refer to the data measured by "SoC specs".Specifically, look for data measured by benchmark measurement applications on the Web.First, you need to know the specifications of the device you use as a reference, and then select a few devices with a somewhat lower measured value.
Once you have identified the devices, actually install the application and check its operation.Do not be discouraged if the operation is slow. You are now at the starting line where you can discuss what to eliminate.In the next section, we will introduce some important specifications that you should consider when eliminating features.
There are several benchmark measurement applications, but I use Antutu as my benchmark.This is because there is a website that compiles measurement data andvolunteers are actively reporting their measurement data.
1.1.4. Determine quality setting specifications.
With the market flooded with devices of various specifications, it would be difficult to cover many devices with a single specification.Therefore, in recent years, it has become common practice to set several quality settings in the game to guarantee stable operation on a variety of devices.
For example, the following items can be classified into high, medium, and low quality settings.
- Screen resolution
- Number of objects displayed
- Shadows
- Post-effect function
- Frame rate
- Ability to skip CPU-intensive scripts, etc.
However, this will reduce the quality of the look and feel of the project, so please consult with the director andtogether explore what line is acceptable for the project.
1.2. Prevention
As with defects, performance degradation can have a variety of causes over time, increasing the difficulty of investigation.It is a good idea to implement a mechanism in your application that will allow you to notice the problem as early as possible.A simple and effective way to do this is to display the current application status on the screen.It is recommended that at least the following elements be displayed on the screen at all times
- Current frame rate
- Current memory usage

Figure 1.3: Performance Visualization
While frame rate can be detected by the user's experience that performance is declining, memory can only be detected by crashes.Figure 1.3 The probability of detecting memory leaks at an early stage will increase simply by constantly displaying them on the screen as shown in the following table.
This display method can be further improved to be more effective.For example, if the target frame rate is 30 frames per second, turn the display green for frames between 25 and 30, yellow for frames between 20 and 25, and red for frames below that.This way, you can intuitively see at a glance whether the application meets the criteria.
1.3. Work on performance tuning
No matter how much effort you put into preventing performance degradation before it happens, it will be tough to prevent it all.This is unavoidable. Performance degradation is an inseparable part of development. There will come a time when you will have to face performance tuning.In the following sections, we will explain how you should tackle performance tuning.
1.3.1. Preparation for Performance Tuning
Before starting performance tuning, let's first introduce an important attitude.For example, let's say you have an application with a slow frame rate. Obviously, several rich models are displayed.People around you are saying that these models must be the cause.We need to look carefully at the evidence to see if this is really the case.There are two things to keep in mind when tuning performance.
The first is to measure and identify the cause. Do not guess.
Second, after making corrections, be sure to compare the results. You may want to compare the before and after profiles.The point is to check for performance degradation across the board, not just in the modified area.The scary part of performance tuning is that in rare cases, the modified part is faster, but the load increases in other parts of the system, and the overall performance is degraded.This is the end of the line.
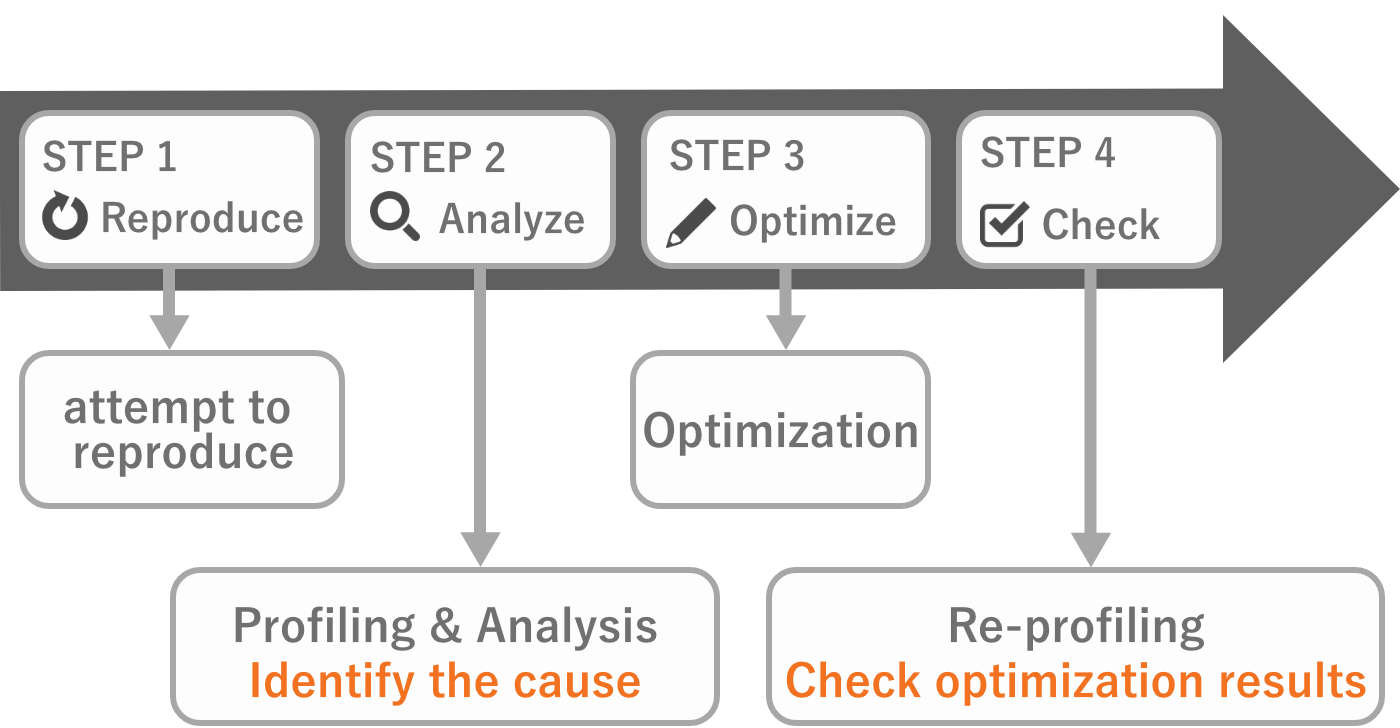
Figure 1.4: Preparation for Performance Tuning
To identify the cause of the problem and confirm that the system has become faster. This is an important attitude for performance tuning.
1.3.2. Types of Performance Degradation
Performance degradation may refer to different things.In this document, we define the three broad categories as follows. ( Figure 1.5)

Figure 1.5: Causes of performance degradation
First, crashes can be classified into two main types: "memory overflow" or"program execution error.The latter is not the domain of performance tuning, so the specifics will not be covered in this document.
Next, "CPU and GPU processing time" will probably account for the majority of screen dropouts and long loading times.In the following sections, we will focus on "memory" and "processing time" to delve deeper into performance degradation.
1.4. Isolating Causes of Excess Memory
We have already discussed possible causes of crashes due to excess memory.From here, let's further break down the causes of excess memory.
1.4.1. Memory leak
One possible cause of memory overflow is a memory leak.To check for this, let's see if memory usage gradually increases with scene transitions.Scene transitions here are not just screen transitions, but also large screen changes.For example, from the title screen to out-game, from out-game to in-game, etc.Follow the steps below to measure the memory usage.
- Note the memory usage in a certain scene
- Transition to a different scene
- Repeat "1" to "2" about 3 to 5 times
If the measurement results show a net increase in memory usage, something is definitely leaking.This can be called an invisible defect. First, let's eliminate the leak.
It is also a good idea to sandwich a few screen transitions before making the "2" transition.This is because it is possible that only the resources loaded on a particular screen are exceptionally leaked.
Once you are sure of the leak, you should look for the cause of the leak."1.5 Let's investigate memory leaks." explains how to investigate specifically.
Reasons for repeating
This is the author's experience, but there were cases where some resources were not released due totiming issues after resource release (after UnloadUnusedAssets).These unreleased resources are released when transitioning to the next scene.In contrast, a gradual increase in memory usage with repeated transitions will eventually cause a crash.In order to separate the former problem from the latter, this document recommends repeating transitions several times during memory measurement.
Incidentally, if there is a problem like the former, some object is probably still holding a reference at the time of resource release and is subsequently released.It is not fatal, but it is a good idea to investigate the cause of the problem and resolve it.
1.4.2. Memory usage is simply too high.
If memory usage is high without leaks, it is necessary to explore areas where it can be reduced.Specific methods are described at "1.6 Let's reduce memory".
1.5. Let's investigate memory leaks.
First, let's reproduce the memory leak and then use the following tools to find the cause.Here we will briefly explain the features of the tools.Details on how to use the tools are handled at Chapter 3 "Profiling Tools", so please refer to it while investigating.
Profiler (Memory)
This is a profiler tool that is included by default in the Unity editor.Therefore, you can easily perform measurement. Basically, you should snapshot the memory with "Detailed" and "Gather object references" set and investigate.Unlike other tools, this tool does not allow snapshot comparisons of measurement data.For more information on how to use this tool, please refer to "3.1.3 Memory".
Memory Profiler
This one must be installed from Package Manager.It graphically displays memory contents in a tree map.It is officially supported by Unity and is still being updated frequently.Since v0.5, the method of tracking reference relationships has been greatly improved, so we recommend using the latest version.See "3.4 Memory Profiler" for details on usage.
Heap Explorer
This must be installed from the Package Manager.It is a tool developed by an individual, but it is very easy to use and lightweight.It is a tool that can be used to track references in a list format, which is a nice addition to the Memory Profiler of v0.4 and earlier.It is a good alternative tool to use when the v0.5 Memory Profiler is not available.See "3.5 Heap Explorer" for details on how to use it.
1.6. Let's reduce memory
The key to reducing memory is to cut from large areas.Because 1,000 pieces of 1KB will only result in a 1MB reduction. However, if you compress a 10 MB texture to 2 MB, you can reduce it by 8 MB.Considering cost-effectiveness, be aware that you should start with the largest items and reduce them first.
In this section, the tool used for memory reduction is Profiler(Memory).If you have never used it, please visit "3.1.3 Memory" for more information.
Subsequent sections will cover items to look for when reducing.
1.6.1. Assets
If Simple View has a lot of Assets, it may be due to unnecessary assets or memory leaks.The Assets-related area here is the area enclosed by the rectangle at Figure 1.6.
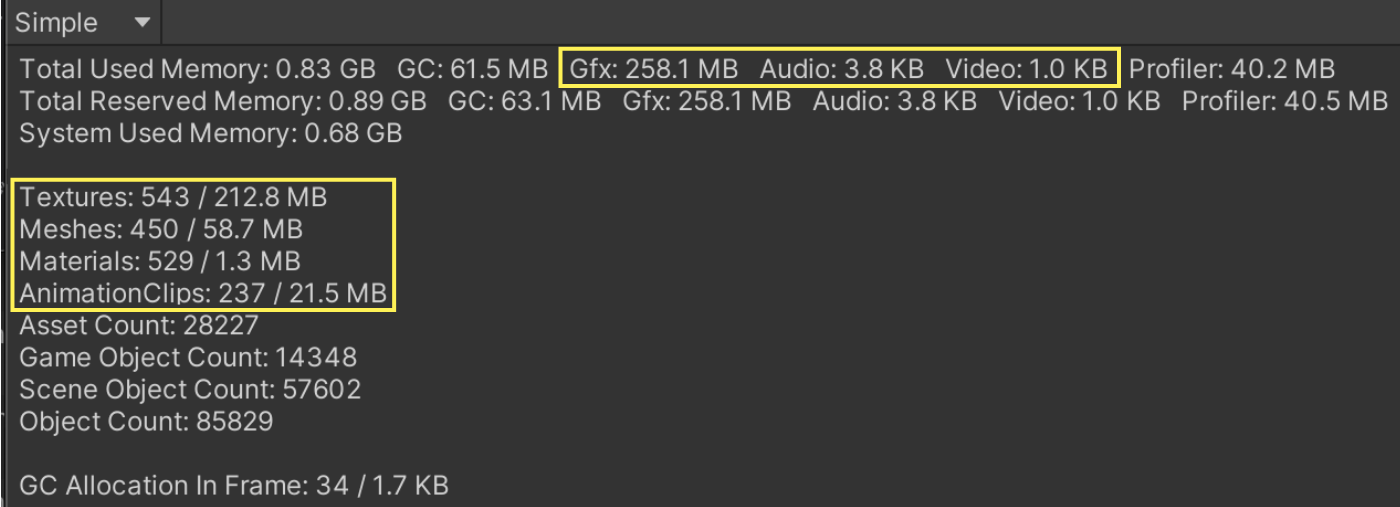
Figure 1.6: Assets-related items
In this case, there are three things to investigate
Unnecessary Assets Investigation
Unnecessary assets are resources that are not needed at all for the current scene.For example, background music that is only used in the title screen is residing in memory even in out game.First, make sure that only those assets that are necessary for the current scene are used.
Duplicate Asset Investigation
This often occurs when supporting asset bundles.The same asset is included in multiple asset bundles due to poor separation of asset bundle dependencies.However, too much separation of dependencies leads to an increase in the number of downloaded files and the cost of file deployment.It may be necessary to develop a sense of balance while measuring this area.For more information on asset bundling, please refer to "2.4.6 AssetBundle".
Check the Regulations
Review each item to see if the regulations are followed.If there are no regulations, check to see if you may not be estimating memory properly.
For example, for textures, you may want to check the following
- Is the size appropriate?
- Are the compression settings appropriate?
- Are the MipMap settings appropriate?
- Read/Write settings are appropriate, etc.
Please refer to Chapter 4 "Tuning Practice - Asset" for more information on what to look out for in each asset.
1.6.2. GC (Mono)
If there is a lot of GC (Mono) in Simple View, it is likely that a large GC.Alloc is occurring at one time.Or memory may be fragmented due to GC.Alloc occurring every frame.These may be causing extra expansion of the managed heap area.In this case, you should steadily reduce GC.Alloc.
See "2.1.5 Memory" for more information on managed heap.Similarly, details on GC.Alloc are handled at "2.5.1 Stack and Heap".
Notation Differences by Version
GC" is shown as "GC" in 2020.2 and later versions, while "Mono" is shown up to 2020.1 and below.Both refer to the amount of managed heap space occupied.
1.6.3. Other
Check for suspicious items in the Detailed View.For example, you may want to open the Other item once to investigate.
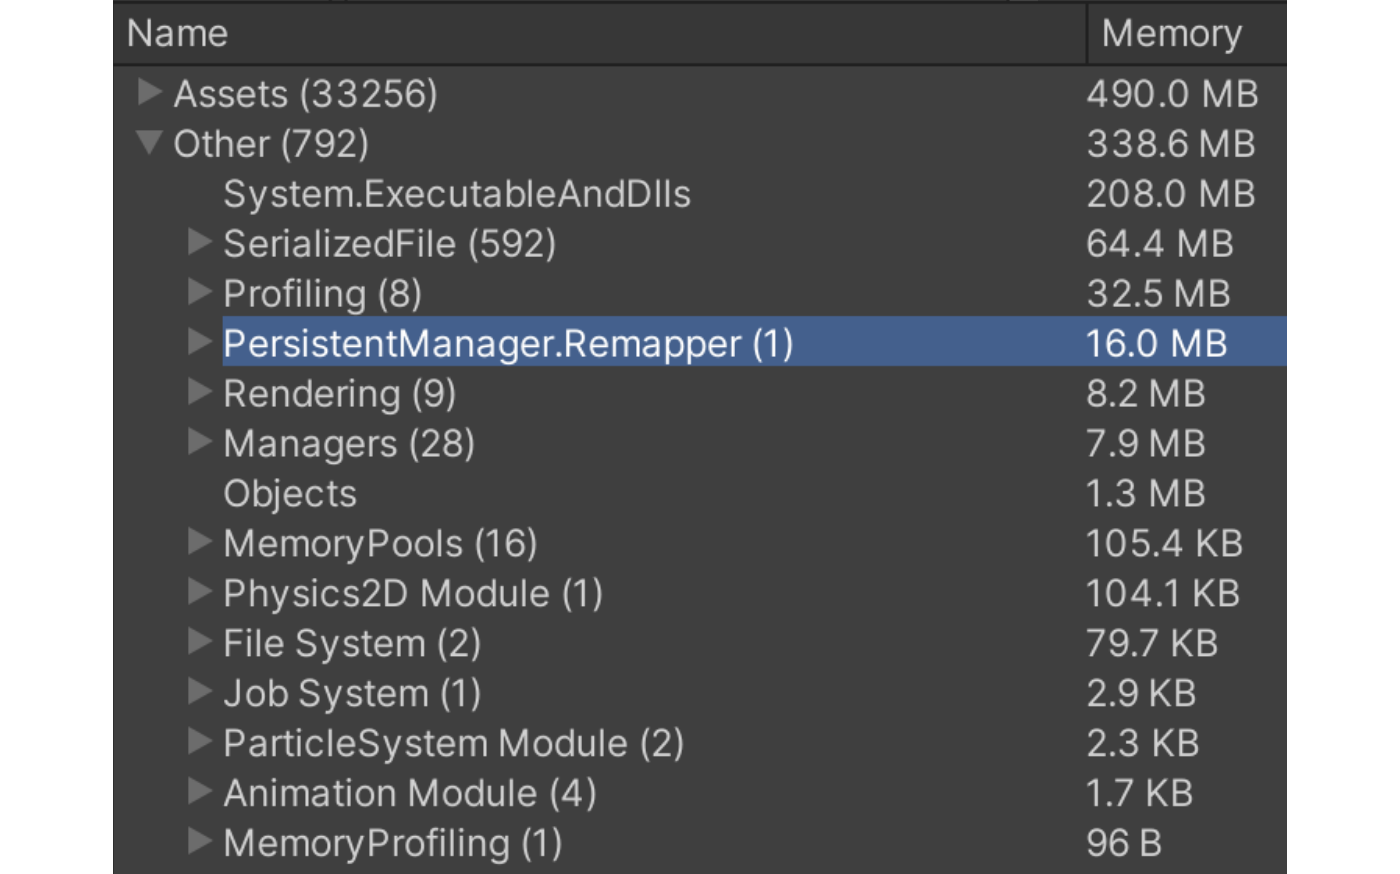
Figure 1.7: Other items
In my experience, SerializedFile and PersistentManager.Remapper were quite bloated.If you can compare values across multiple projects, it is a good idea to do so once.Comparing the values of each may reveal outliers.See "2. Detailed view" for more information.
1.6.4. Plug-ins
So far we have used Unity's measurement tools to isolate the cause of the problem.However, Unity can only measure memory managed by Unity.In other words, the amount of memory allocated by plug-ins is not measured.Check to see if ThirdParty products are allocating extra memory.
Use the native measurement tool (Instruments in Xcode).See "3.7 Instruments" for more information.
1.6.5. Examine the specifications.
This is the last step.If there is nothing that can be cut from what we have covered so far, we have no choice but to consider the specifications.Here are some examples
- Change the compression ratio of textures
- Increase the compression ratio one step for one part of the texture
- Change the timing of loading/unloading
- Release objects in resident memory and load them each time.
- Change load specifications
- Reduce the number of character variations to be loaded ingame by one.
All of these changes have a large impact and may fundamentally affect the fun of the game.Therefore, specification considerations are a last resort.Make sure to estimate and measure memory early on to prevent this from happening.
1.7. Isolating the Cause of Processing Failures
The following is an introduction to the process of measuring and optimizing processing time.The way to deal with screen processing failures varies depending on whether they are "instantaneous" or "steady" processing failures.
Instantaneous processing slowdowns are measured as a processing load that is sharp like a needle.They are also called spikes because of their appearance.
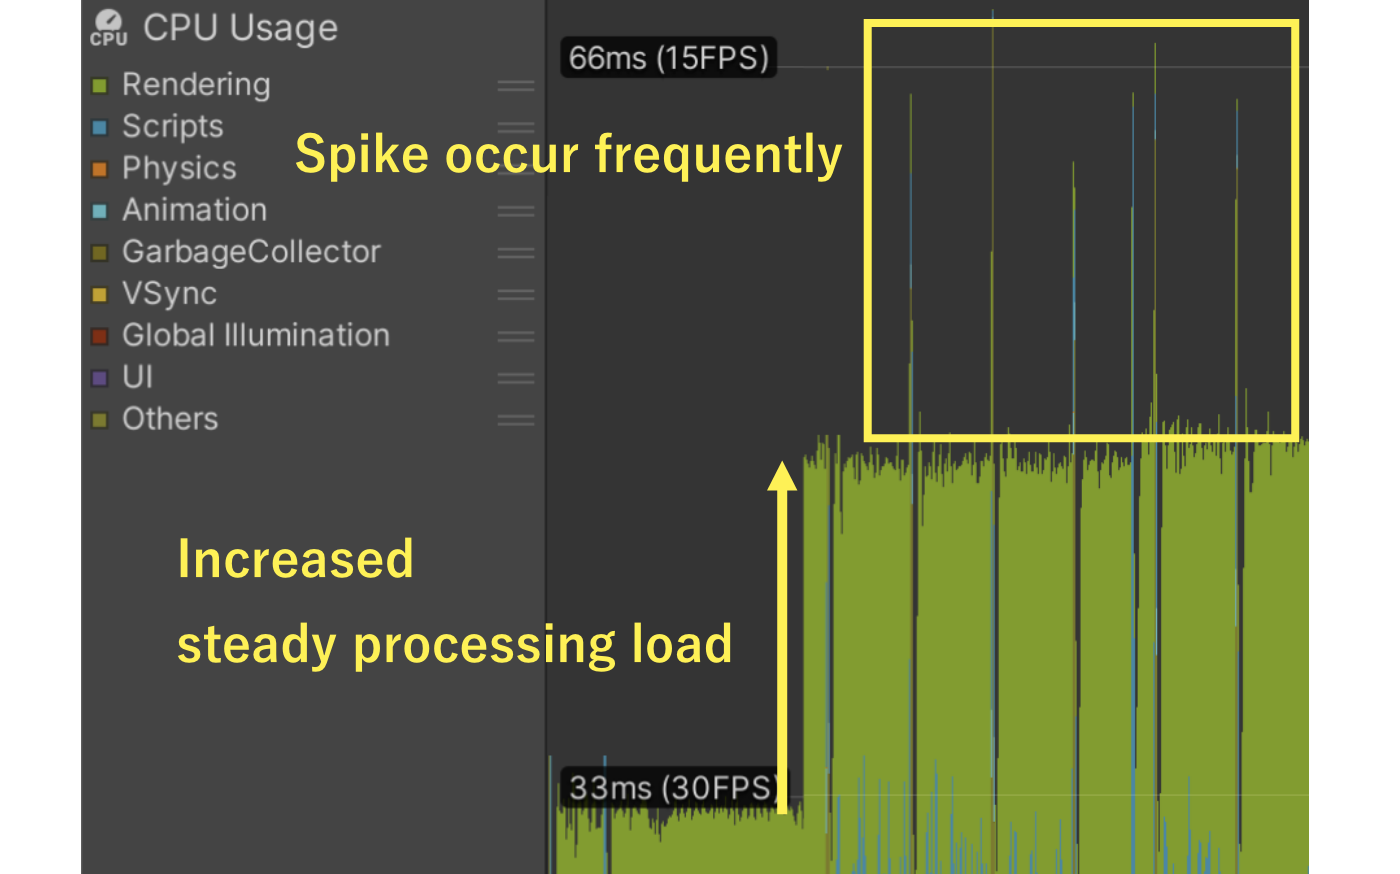
Figure 1.8: Spikes and steady processing load
Figure 1.8 In the following section, the measured data shows a sudden increase in steady-state load, as well as periodic spikes.Both events will require performance tuning.First, a relatively simple instantaneous load study will be explained.Then, the steady-state load survey will be explained.
1.8. Investigating Instantaneous Load
As a method of investigating spikes, Profiler (CPU) is used to investigate the cause.
See "3.1.2 CPU Usage" for detailed usage of the tool.First, isolate whether the cause is due to GC or not.Deep Profile is not necessary to isolate the cause itself, but it will be needed to solve the problem.
1.8.1. Spikes caused by GC
If GC (garbage collection) is occurring, GC.Alloc should be reduced.Deep Profile to see which processes are allocating how much.The first areas that should be reduced are those that are cost-effective.It is recommended to focus on the following items.
- Areas allocated every frame
- Areas where a large number of allocations are occurring
The fewer the allocations, the better, but this does not mean that allocations should be zero.For example, there is no way to prevent allocations that occur during the Instantiate process.In such cases, pooling, in which objects are used instead of generating objects each time, is effective.For more information on GC, please refer to "2.5.2 Garbage Collection".
1.8.2. Spikes due to heavy processing
If GC is not the cause, some kind of heavy processing is being performed instantaneously.Again, let's use Deep Profile to investigate what and how much processing is heavy, and review the areas that are taking the longest time to process.
The following are some of the most common temporary heavy processes.
- Instantiate processing
- Active switching of a large number of objects or objects in a deep hierarchy
- Screen capture processing, etc.
As this is a part that is highly dependent on the project code, there is no one-size-fits-all solution.If the actual measurement reveals the cause, please share the measurement results with the project members and discuss how to improve it.
1.9. Investigate the steady-state load
When improving the steady processing load, it is important to reduce the processing within a single frame.The processing performed within a single frame can be roughly divided into CPU processing and GPU processing.First, it is a good idea to isolate which of these two processes is the bottleneck, or which has the same processing load.
A situation where the CPU is the bottleneck is called CPU-bound, and a situation where the GPU is the bottleneck is called GPU-bound.
As an easy way to isolate the two, if any of the following apply to you, there is a good chance that you are GPU-bound.
- Dramatic improvement in processing load when the screen resolution is lowered
- When measured with Profiler Gfx.WaitForPresent is present
On the other hand, if these are not present, there is a possibility of CPU bounce.In the following sections, we will explain how to investigate CPU bounces and GPU bounces.
1.9.1. CPU Bound
CPU bound uses CPU (Profiler), which was also discussed in the previous section.It investigates using Deep Profile and checks whether a large processing load is applied to a specific algorithm.If there is no large processing load, it means that the system is equally heavy, so steadily improve the system.If you cannot reach the target reduction value even after making steady improvements, you may want to go back to"1.1.4 Determine quality setting specifications." and reconsider.
1.9.2. GPU Bound
In the case of GPU bounces, you may want to investigate using the Frame Debugger.See "3.3 Frame Debugger" for details on how to use it.
Is the resolution appropriate?
Among GPU bounces, resolution has a significant impact on the processing load of the GPU.Therefore, if the resolution is not set appropriately, the first priority should be to set it to an appropriate resolution.
First, check to see if the resolution is appropriate for the assumed quality settings.A good way to check is to look at the resolution of the render target being processed in the Frame Debugger.If you have not intentionally implemented the following, work on optimization.
- Only UI elements are rendered at the full resolution of the device.
- Temporary textures for post-effects have a high resolution, etc.
Are there any unnecessary objects?
Check the Frame Debugger to see if there are any unnecessary drawings.For example, there may be an unneeded camera active that is drawing unrelated objects behind the scenes.If there are many cases where the previous drawing is wasted due to other obstructions, use the Occlusion Culling may be a good option.For more information on occlusion culling, see "7.5.3 Occlusion culling".
Note that occlusion culling requires data to be prepared in advance and that memory usage will increase as the data is deployed to memory.It is a common practice to build pre-prepared information in memory to improve performance in this way.Since memory and performance are often inversely proportional, it is a good idea to be aware of memory as well when employing something.
Is batching appropriate?
Batching is the process of drawing all the objects at once.Batching is effective for GPU bouncing because it improves drawing efficiency.For example, Static Batching can be used to combine the meshes of multiple immobile objects.
There are many different methods for batching, so I will list some of the most common ones.If you are interested in any of them, please refer to "7.3 Reducing Draw Calls".
- Static Batching
- Dynamic Batching
- GPU Instancing
- SRP Batcher, etc.
Look at the load individually
If the processing load is still high, the only way is to look at it individually.It may be that the object has too many vertices or that the shader processing is causing the problem.To isolate this, switch the active state of each object and see how the processing load changes.Specifically, we can try deactivating the background and see what happens, deactivate the characters and see what happens, and so on.Once the categories with high processing load are identified, the following factors should be further examined.
- Are there too many objects to draw?
- Consider whether it is possible to draw them all at once.
- Is the number of vertices per object too large?
- Consider reduction and LOD
- Is the processing load improved by replacing with a simple Shader?
- Review the processing of Shader
Otherwise
It can be said that each GPU processing is piled up and heavy.In this case, the only way is to steadily improve one by one.
Also, as with CPU bound, if the target reduction cannot be reached, it is a good idea to go back to"1.1.4 Determine quality setting specifications." and reconsider.
1.10. Conclusion
In this chapter, we have discussed what to watch out for "before" and "during" performance tuning.
The things to watch out for before and during performance tuning are as follows
- Decide on "indicators," "guaranteed devices," and "quality setting specifications.
- Verify and determine the indicators before mass production.
- Create a mechanism to easily notice performance degradation.
The following are things to keep in mind during performance tuning.
- Isolate the cause of performance degradation and take appropriate measures.
- Be sure to follow the sequence of "measurement," "improvement," and "re-measurement (checking the results).
As explained up to this point, it is important to measure and isolate the cause of performance tuning.Even if a case not described in this document occurs, it will not be a major problem if the fundamentals are followed.If you have never done performance tuning before, we hope that you will put the information in this chapter into practice.