Chapter 3. Profiling Tools
Profiling tools are used to collect and analyze data, identify bottlenecks, and determine performance metrics.There are several of these tools provided by the Unity engine alone.Other tools include native-compliant tools such as Xcode and Android Studio, and GPU-specific tools such as RenderDoc.Therefore, it is important to understand the features of each tool and choose appropriately.In this chapter, we will introduce each tool and discuss profiling methods, aiming to help you use each tool appropriately.
3.0.1. Points to keep in mind when measuring
Since Unity can run applications on the editor, measurements can be taken both on the actual device and in the editor.It is necessary to keep in mind the characteristics of each environment when performing measurements.
The greatest advantage of using the editor is that it allows for quick trial and error.However, since the processing load of the editor itself and the memory area used by the editor are also measured, there will be a lot of noise in the measurement results.Also, since the specifications are completely different from those of the actual equipment, it is difficult to identify bottlenecks and the results may differ.
For this reason, we recommend that profiling be done on the actual device.However, it is efficient to complete the work only with the editor, which is less expensive, only when "it occurs in both environments.Most of the time, the problem is reproduced in both environments, but in rare cases, it may only be reproduced in one of the environments.Therefore, first confirm the phenomenon on the actual device. Next, it is recommended to confirm that the problem is reproduced in the editor as well, and then correct it in the editor.Of course, be sure to check the correction on the actual device at the end.
3.1. Unity Profiler
The Unity Profiler is a profiling tool built into the Unity Editor.This tool can collect information on a frame-by-frame basis.There is a wide range of items that can be measured, each called a profiler module, and in the Unity 2020 version there are 14 of them.This module is still being updated, and in Unity 2021.2, a new module on Asset and a new module on File I/O have been added.The Unity Profiler is a great tool for getting a rough look at performance because of the variety of modules available.The list of modules can be found at Figure 3.1.
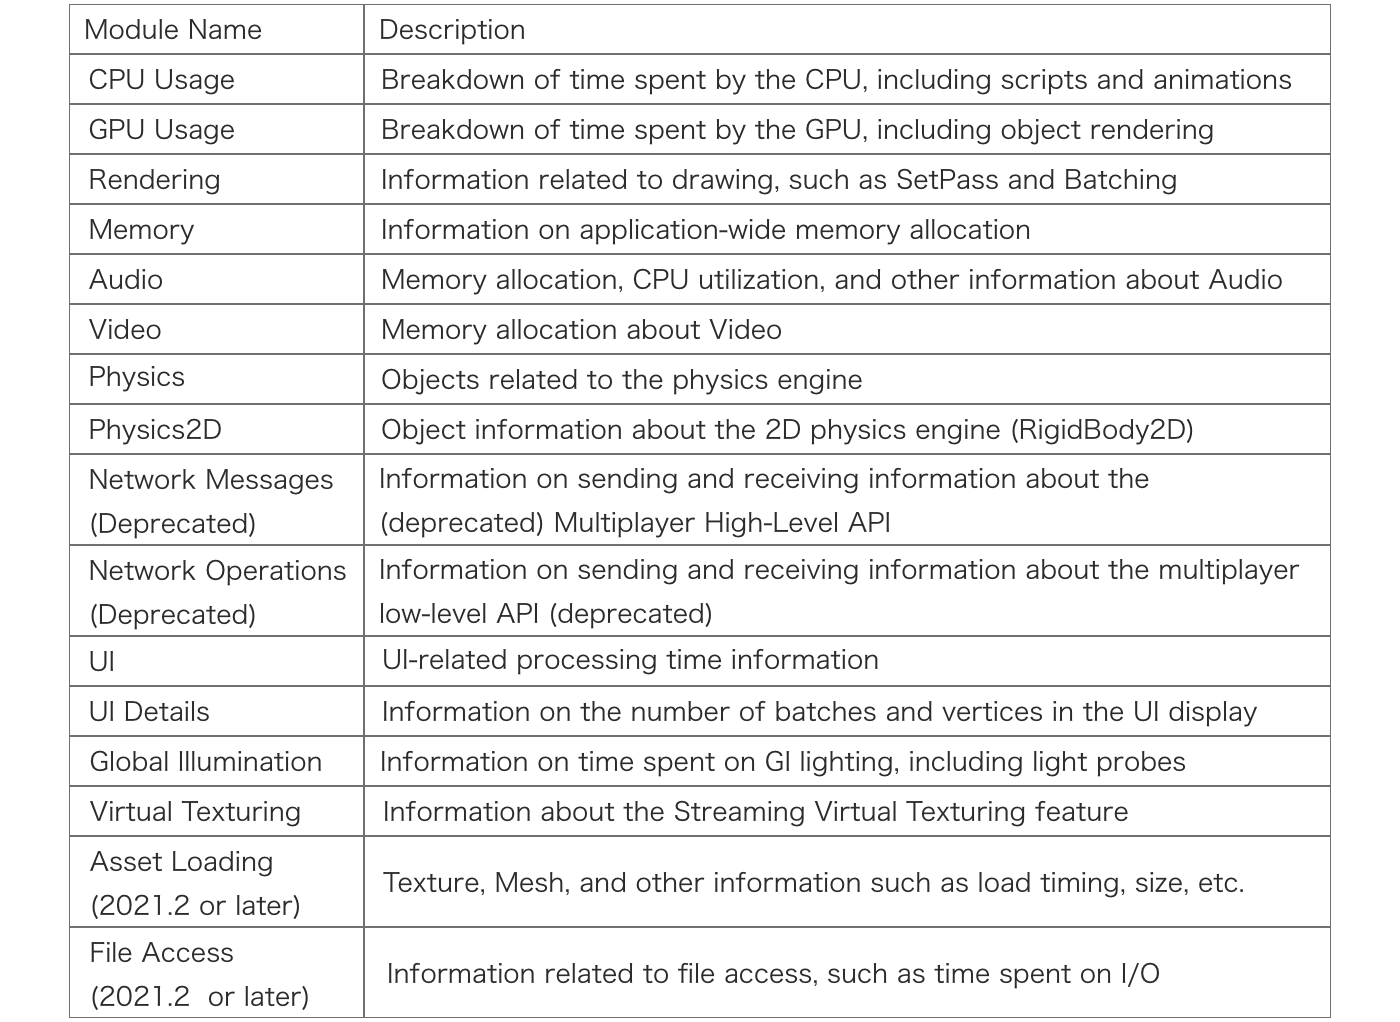
Figure 3.1: List of Profiler Modules
These modules can be configured to be displayed or not on the profiler.However, modules that are not displayed are not measured. Conversely, if all of them are displayed, the editor will be overloaded.
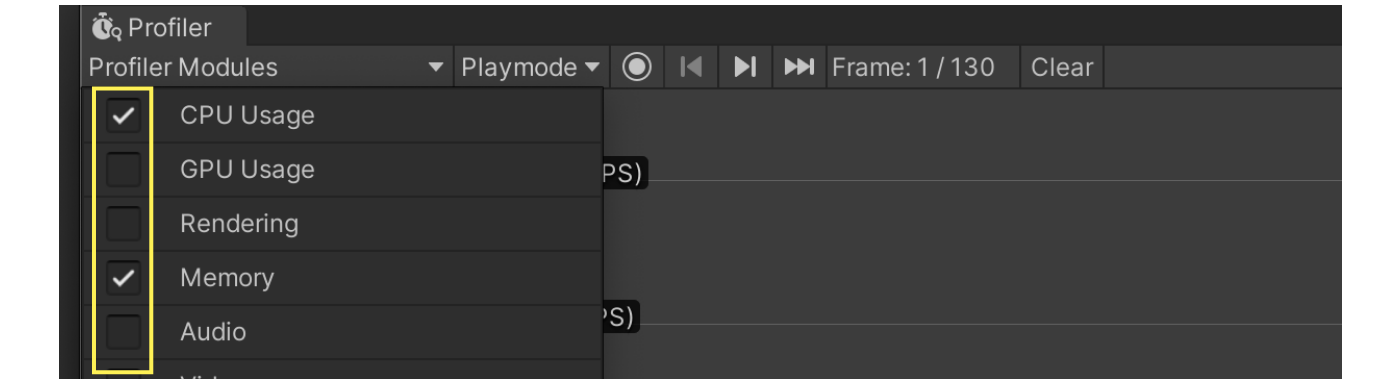
Figure 3.2: Show/Hide Function of Profiler Modules
The following are also useful functions common to the entire Profiler tool.
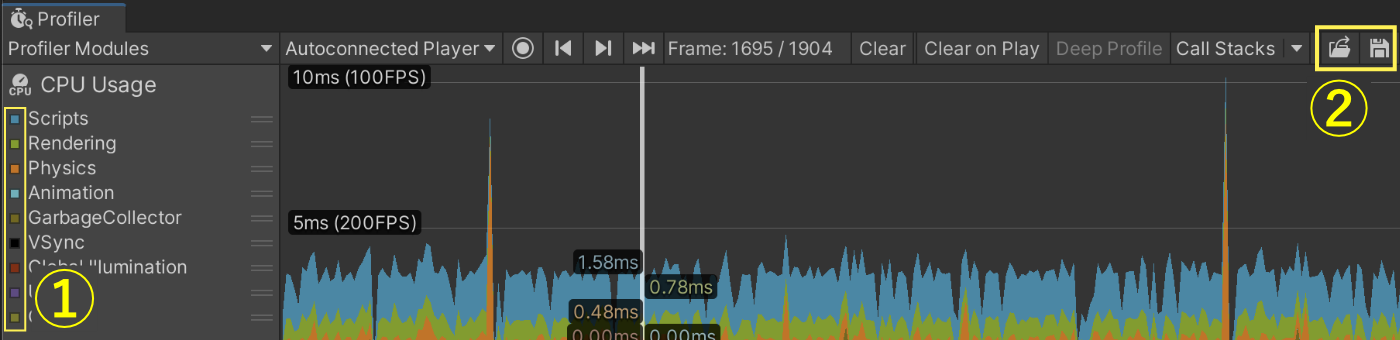
Figure 3.3: Explanation of Profiler Functions
Figure 3.3 In the "Profiler Modules" section, "①" lists the items that each module is measuring.By clicking on this item, you can switch between display and non-display on the timeline on the right.Displaying only the necessary items will make the view easier to read.You can also reorder the items by dragging them, and the graph on the right side will be displayed in that order.The second item (2) is a function for saving and loading the measured data. It is recommended to save the measurement results if necessary.Only the data displayed on the profiler can be saved.
This book explains CPU Usage and Memory module, which are frequently used in Figure 3.1.
3.1.1. Measurement Methods
This section covers measurement methods using the Unity Profiler on an actual device.We will explain the measurement method in two parts, one before building and the other after launching the application.The measurement method in the editor is simply to click the measurement button during execution, so the details are omitted.
Work to be done before building
The work to be done before building is Development Build is to enable the "Development Build" setting.Once this is activated, a connection to the profiler can be established.
Also, we will need to enable the Deep Profile option for more detailed measurement.When this option is enabled, the processing time of all function calls is recorded, making it easier to identify bottleneck functions.The disadvantage is that the measurement itself requires a very large overhead, making it slow and memory intensive.Note that the process may appear to take a very long time, but not so much in the normal profile.Basically, it is used only when the normal profile does not provide enough information.
If Deep Profile uses a lot of memory, such as in a large project, it may not be possible to make measurements due to insufficient memory.In that case, you have no choice but to add your own measurement process by referring to "Supplement: About Sampler" in the "3.1.2 CPU Usage" section.
There are two ways to configure these settings: by explicitly specifying them in a script or by using the GUI.First, we will introduce the method of setting from a script.
List 3.1: How to set up Development Build from a script
BuildPlayerOptions buildPlayerOptions = new BuildPlayerOptions(); /* Scene and build target settings are omitted. */ buildPlayerOptions.options |= BuildOptions.Development; // Add only if you want to enable Deep Profile mode buildPlayerOptions.options |= BuildOptions.EnableDeepProfilingSupport; BuildReport report = BuildPipeline.BuildPlayer(buildPlayerOptions); |
List 3.1 The important point in BuildOptions.Development is to specify .
Next, if you want to set up from GUI, go to Build Settings and check Development Build like Figure 3.4 and build.
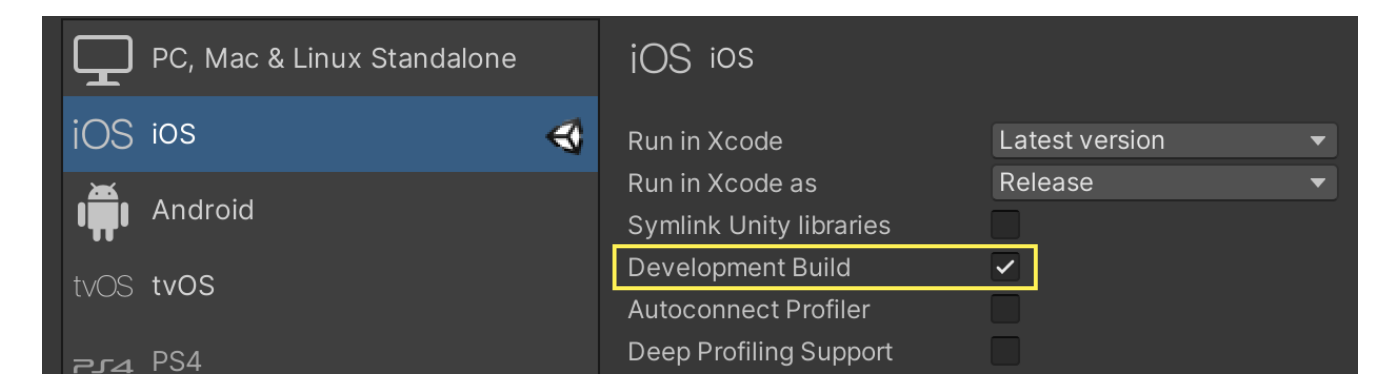
Figure 3.4: Build Settings
Work to be done after application startup
There are two ways to connect with Unity Profiler after application startup: "Remote Connection" and "Wired (USB) Connection".The remote connection has more environmental restrictions than the wired connection, and the profile may not work as expected.For example, connection to the same Wifi network may be required, mobile communication may need to be disabled for Android only, and other ports may need to be freed.For this reason, this section will focus on wired connections, which are simpler and more reliable to profile.If you want to make a remote connection, please refer to the official documentation to give it a try.
First of all, for iOS, the procedure to connect to the profiler is as follows.
- Change Target Platform to iOS from Build Settings
- Connect the device to your PC and launch the Development Build application
- Select the device to connect to from Unity Profiler ( Figure 3.5 )
- Start Record
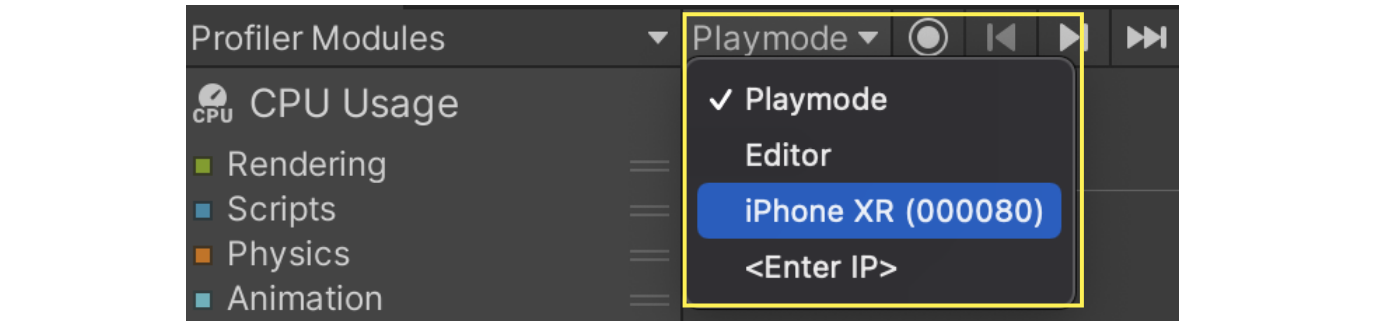
Figure 3.5: Select the device to connect to
The Unity Editor for measurement does not have to be the project you built.It is recommended to create a new project for the measurement, as it is lightweight.
Next, for Android, there are a few more steps than for iOS.
- Change Target Platform to Android from Build Settings
- Connect the device to the PC and launch the Development Build application
adb forwardEnter the command. (Details of the command are described below.)- Select the device to connect to from Unity Profiler
- Start Record
adb forward The command requires the Package Name of the application.For example, if the Package Name is "jp.co.sample.app", enter the following.
List 3.2: adb forward command
adb forward tcp:34999 localabstract:Unity-jp.co.sample.app |
If adb is not recognized, please set the adb path.There are many web-based instructions on how to set up adb, so we will skip this section.
For simple troubleshooting, if you cannot connect, check the following
- Common to both devices
- Is there a "Development Build" sign in the lower right corner of the executed application?
- In the case of Android
- Is USB debugging enabled on the device?
adb forwardIs the package name entered in the command correct?adb devicesThe device is properly recognized when the command is entered.
As an additional note, if you run the application directly in Build And Run, the adb forward command described above will be performed internally.Therefore, no command input is required for measurement.
Autoconnect Profiler
There is an Autoconnect Profiler option in the build configuration.This option is a function to automatically connect to the editor's profiler when the application is launched.Therefore, it is not a required setting for profiling. The same applies to remote profiling.Only WebGL cannot be profiled without this option, but it is not a very useful option for mobile.
To take this a bit further, if this option is enabled, the IP address of the editor will be written to the binary at build time, and an attempt will be made to connect to that address at startup.If you are building on a dedicated build machine, this is not necessary unless you are profiling on that machine.Rather, you will just have to wait longer (about 8 seconds) for the automatic connection to time out when the application starts.
Note that from the script, the option name is BuildOptions.ConnectWithProfiler, which can easily be mistaken for mandatory.
3.1.2. CPU Usage
CPU Usage is displayed as Figure 3.6.
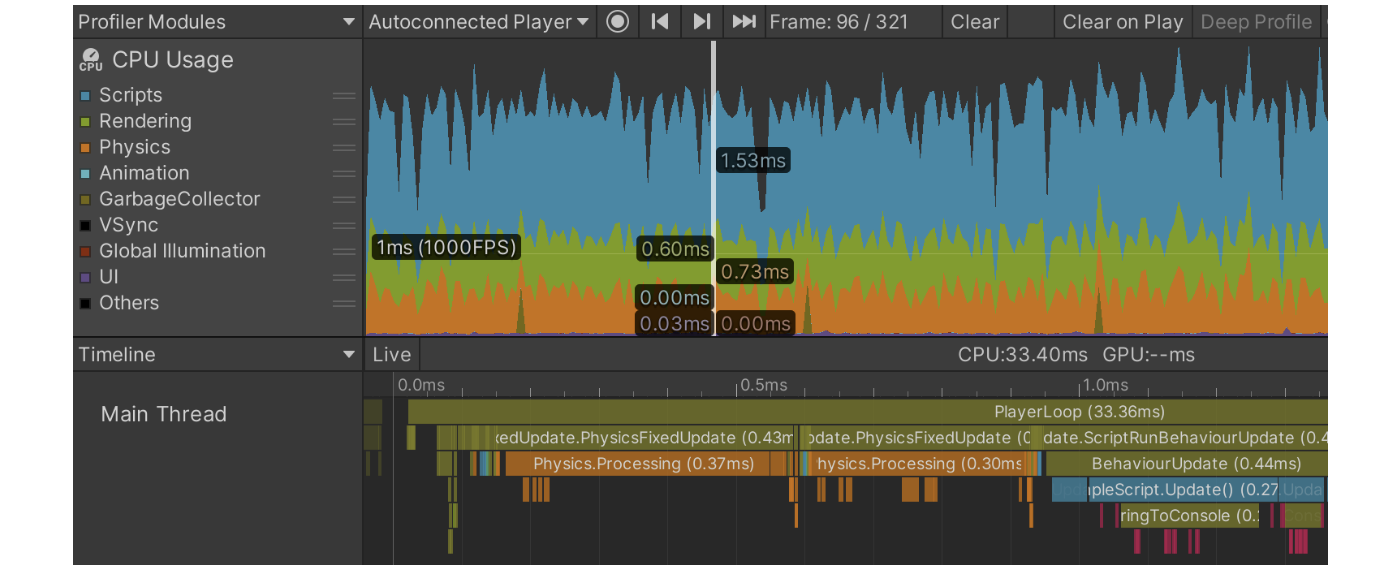
Figure 3.6: CPU Usage Module (Timeline Display)
There are two main ways to check this module
- Hierarchy (Raw Hierarchy)
- Timeline
First, the Hierarchy view is explained in terms of what it shows and how to use it.
1. Hierarchy View
The Hierarchy view looks like Figure 3.7.
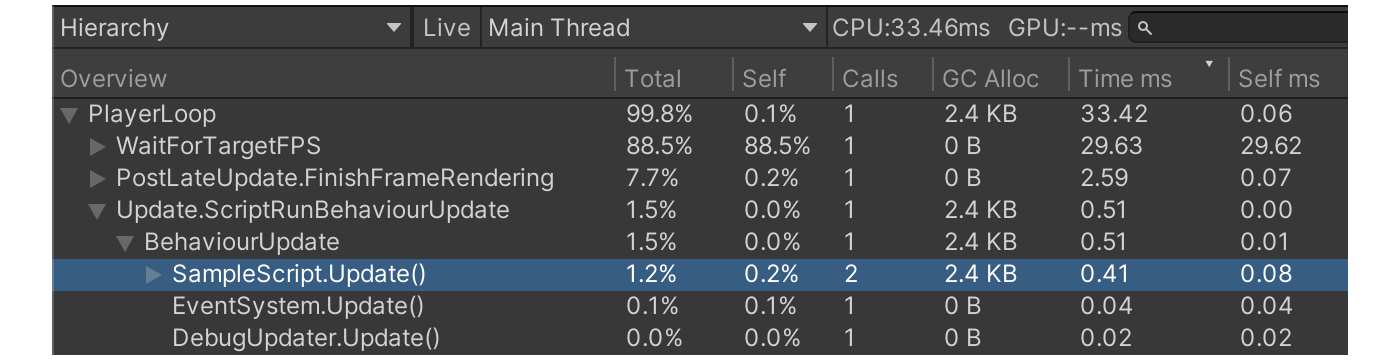
Figure 3.7: Hierarchy View
This view is characterized by the fact that the measurement results are arranged in a list format and can be sorted by the items in the header.When conducting an investigation, bottlenecks can be identified by opening items of interest in the list.However, the information displayed is an indication of the time spent in the selected thread.For example, if you are using Job System or multi-threaded rendering, the processing time in another thread is not included.If you want to check, you can do so by selecting a thread like Figure 3.8.
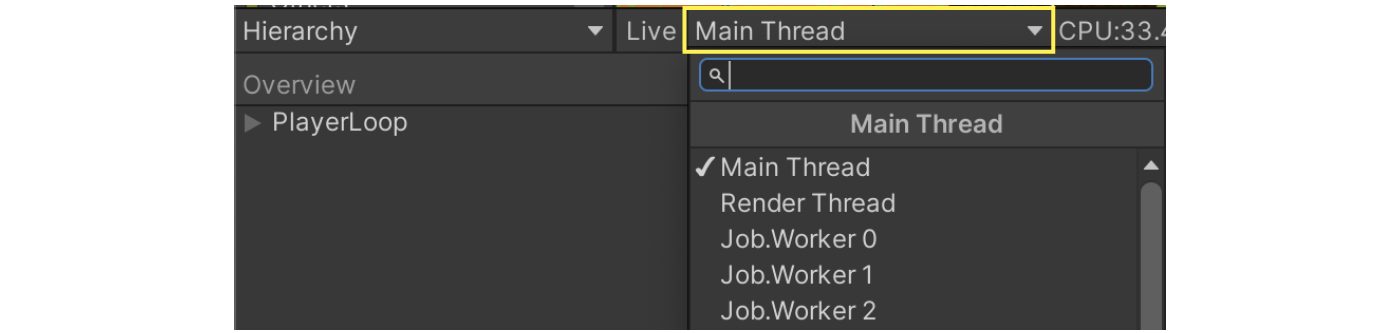
Figure 3.8: Thread Selection
Next, the header items are explained.
Table 3.1: Hierarchy Header Information
| Header Name | Description |
|---|---|
| Overview | Sample name. |
| Total | Total time spent processing this function. (displayed as a percentage) |
| Self | Processing time of this function itself. Subfunction time is not included. (displayed in %) Self |
| Calls | Number of calls made in one frame. |
| GC Alloc | Heap memory allocated by this function. |
| Time ms | Total in ms. |
| Self ms | Self in ms. |
Calls is easier to see as a view because it combines multiple function calls into a single item.However, it is not clear whether all of them have equal processing time or only one of them has a long processing time.In such cases, the Raw Hierarchy View is used in this case.The Raw Hierarchy view differs from the Hierarchy view in that Calls is always fixed at 1.Figure 3.9 In the following example, multiple calls to the same function are shown in the Raw Hierarchy view.
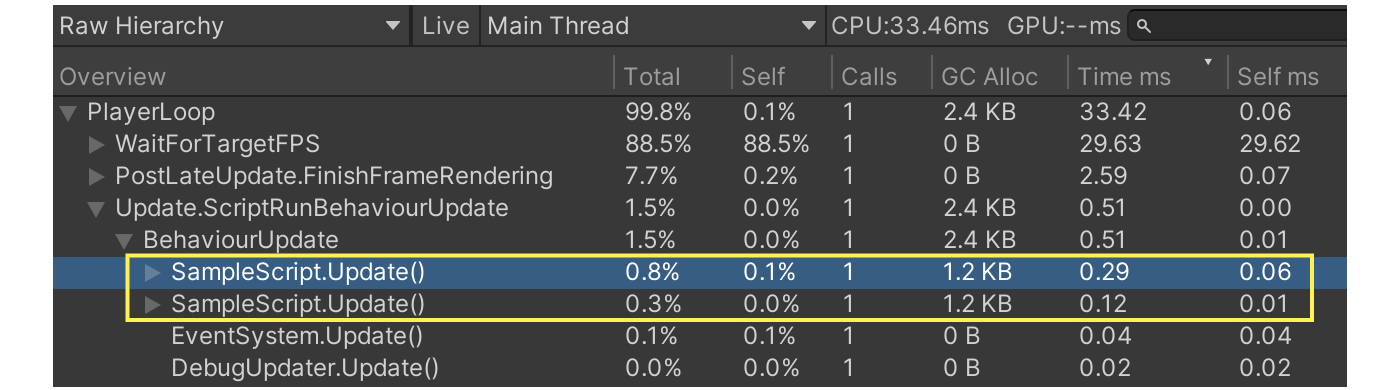
Figure 3.9: Raw Hierarchy View
To summarize what has been said so far, the Hierarchy view is used for the following purposes
- Identify and optimize bottlenecks (Time ms, Self ms)
- Identify and optimize GC allocations (GC Allocation)
When performing these tasks, it is recommended to sort each desired item in descending order before checking it.
When opening an item, it is often the case that there is a deep hierarchy.In this case, you can open all levels of the hierarchy by holding down the Option key on a Mac (Alt key on Windows).Conversely, closing an item while holding down the key will close everything below that hierarchy.
2. timeline view
Another way to check the timeline view is as follows.
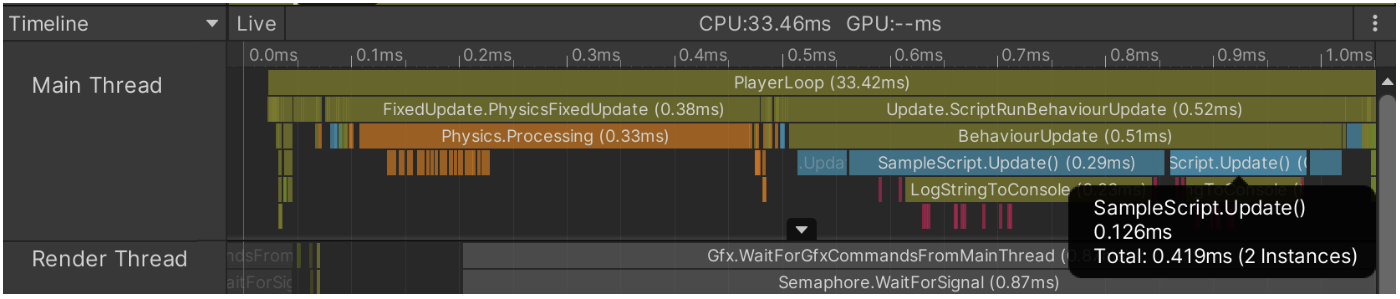
Figure 3.10: Timeline View
In the timeline view, items in the hierarchy view are visualized as boxes, so you can intuitively see where the load is at a glance when viewing the entire view.And because it is mouse-accessible, even deep hierarchies can be grasped simply by dragging.In addition, with timelines, there is no need to switch threads; all threads are displayed.This makes it easy to see when and what kind of processing is taking place in each thread.Because of these features, timelines are mainly used for the following purposes
- To get a bird's eye view of the overall processing load
- To understand and tune the processing load of each thread
Timeline is not suited for sorting operations to determine the order of heavy processing, or for checking the total amount of allocations.Therefore, the Hierarchy View is better suited for tuning allocations.
Supplement: About Sampler
There are two ways to measure processing time per function.One is the Deep Profile mode described above. The other is to embed it directly in the script.
In the case of embedding directly in the script, use the following statement.
List 3.3: Method using Begin/EndSample
using UnityEngine.Profiling;
/* ... Omitted...*/
private void TestMethod()
{
        for (int i = 0; i < 10000; i++)
        {
                Debug.Log("Test");
        }
}

private void OnClickedButton()
{
        Profiler.BeginSample("Test Method")
        TestMethod();
        Profiler.EndSample()
}
|
The embedded sample will be displayed in both the Hierarchy and Timeline views.
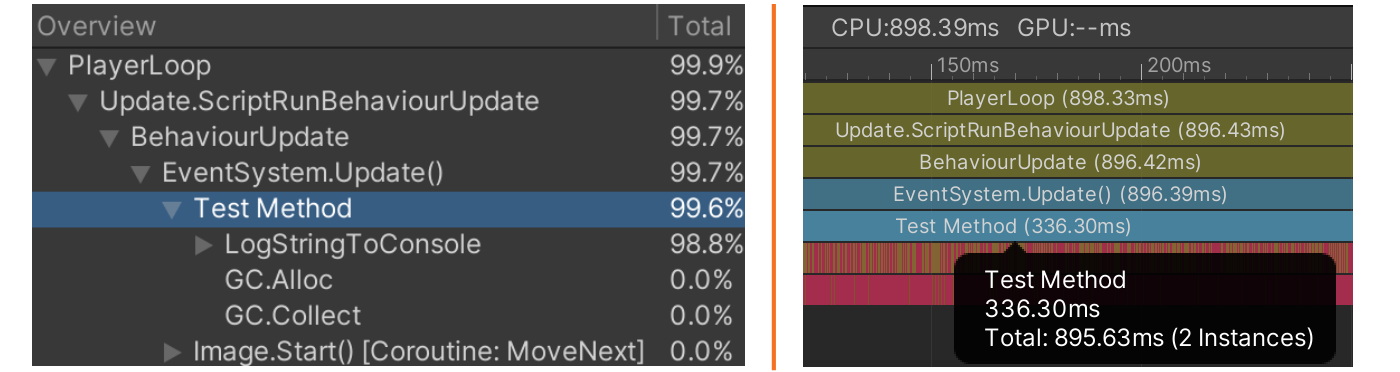
Figure 3.11: Sampler Display
There is one more feature worth mentioning. If the profiling code is not a Development Build, the caller is disabled, so there is zero overhead.It may be a good idea to put this in place in advance in areas where the processing load is likely to increase in the future.
The BeginSample method is a static function, so it can be used easily, but there is also a CustomSampler that has similar functionality.This method was added after Unity 2017 and has less measurement overhead than BeginSample, so it can measure more accurate times.
List 3.4: How to use CustomSampler
using UnityEngine.Profiling;
/* ... Omitted...*/
private CustomSampler _samplerTest = CustomSampler.Create("Test");

private void TestMethod()
{
        for (int i = 0; i < 10000; i++)
        {
                Debug.Log("Test");
        }
}

private void OnClickedButton()
{
        _samplerTest.Begin();
        TestMethod();
        _samplerTest.End();
}
|
The difference is that an instance must be created in advance.Another feature of CustomSampler is that the measurement time can be obtained in the script after the measurement.If you need more accuracy or want to issue warnings based on processing time, CustomSampler is a good choice.
3.1.3. Memory
Memory modules are displayed as Figure 3.12.
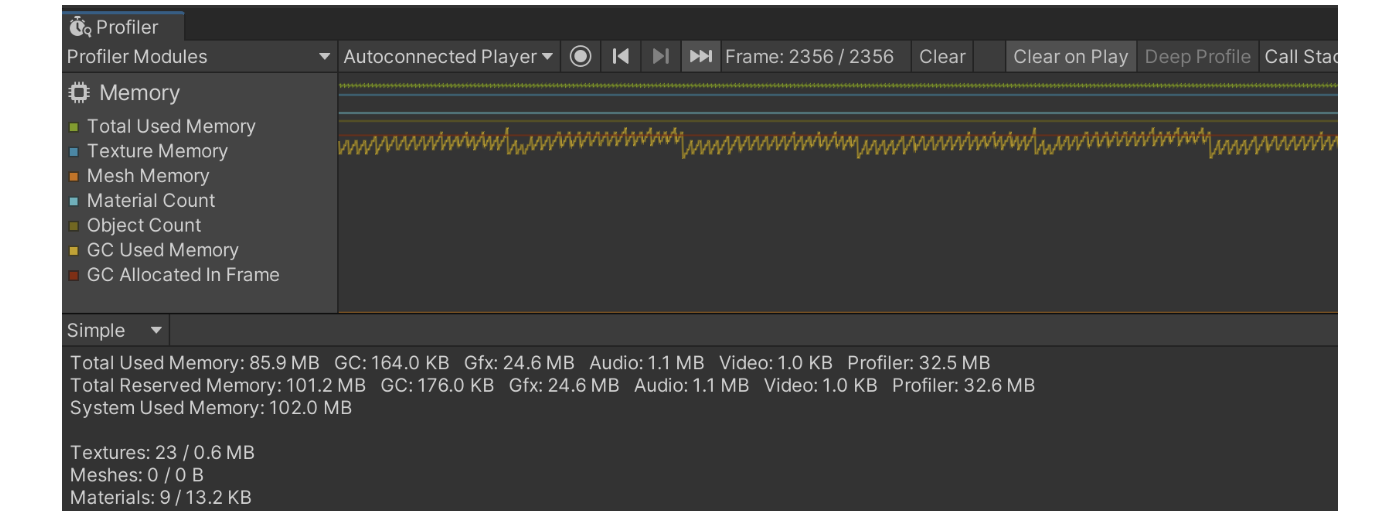
Figure 3.12: Memory Module
There are two ways to check this module
- Simple view
- Detailed view
First, we will explain the contents and usage of the Simple view.
1. simple view
The Simple view looks like Figure 3.13.
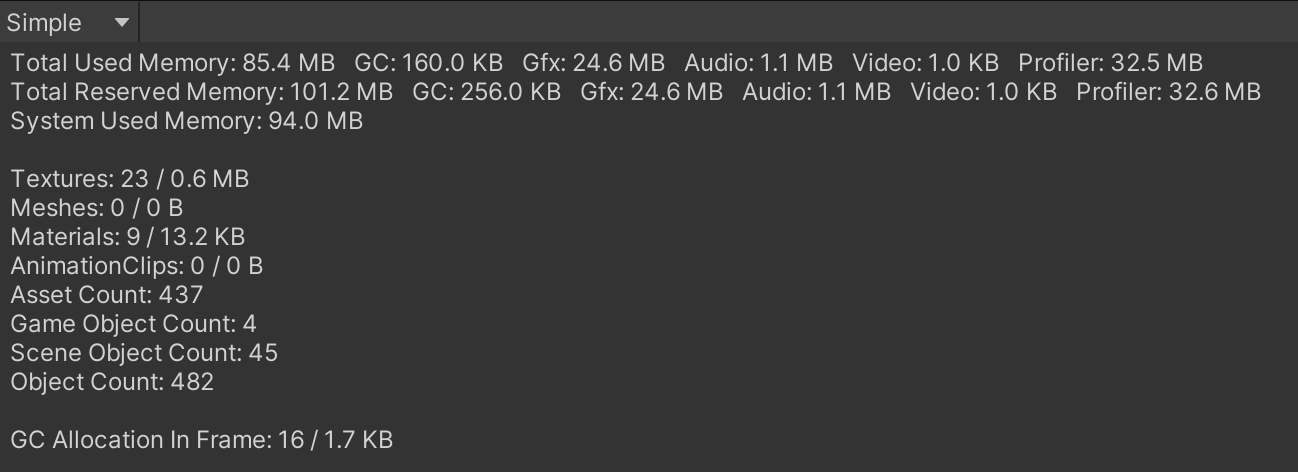
Figure 3.13: Simple View
This section describes the items listed in the view.
- Total Used Memory
- Total amount of memory allocated (in use) by Unity.
- Total Reserved Memory
- Total amount of memory currently reserved by Unity.A certain amount of contiguous memory space is reserved in advance by the OS as a pool, and is allocated when it is needed.When the pool area becomes insufficient, it is requested again from the OS side for expansion.
- System Used Memory
- Total amount of memory used by the application.This item also measures items (plug-ins, etc.) that are not measured in Total Reserved.However, it still does not track all memory allocations.To get an accurate picture, you will need to use a native-compliant profiling tool such as Xcode.
Figure 3.13 The meaning of the items listed to the right of Total Used Memory in
Table 3.2: Simple View glossary
| Term Name | Explanation |
|---|---|
| GC | Amount of memory used in the heap area. GC Alloc and other factors increase this amount. |
| Gfx | Amount of memory allocated for Texture, Shader, Mesh, etc. |
| Audio | Amount of memory used for audio playback. |
| Video | Amount of memory used for video playback. |
| Profiler | Amount of memory used for profiling. |
As an additional note regarding the terminology names, starting with Unity 2019.2, "Mono" has been changed to "GC" and "FMOD" has been changed to "Audio".
Figure 3.13 The number of assets used and the amount of memory allocated for the following are also listed in the following table.
- Texture
- Mesh
- Material
- Animation Clip
- Audio Clip
The following information on the number of objects and GC Allocation is also available.
- Asset Count
- Total number of assets loaded.
- Game Object Count
- Number of game objects in the scene.
- Scene Object Count
- Total number of components and game objects in the scene.
- Object Count
- Total number of all objects generated and loaded by the application.If this value is increasing, it is likely that some objects are leaking.
- GC Allocation in Frame
- The number of times an Allocation has occurred in a frame and the total amount.Finally, this information summarizes the use case for the Simple view.
- Understanding and monitoring heap area and Reserved expansion timing
- Checking for leaks of various assets and objects
- Monitor GC Allocation
The Simple view in Unity 2021 and later has a greatly improved UI, making it easier to see the items displayed.There are no major changes in the content itself, so the knowledge introduced here can be used as is.Note, however, that some of the names have been changed.For example, GC has been renamed Managed Heap.
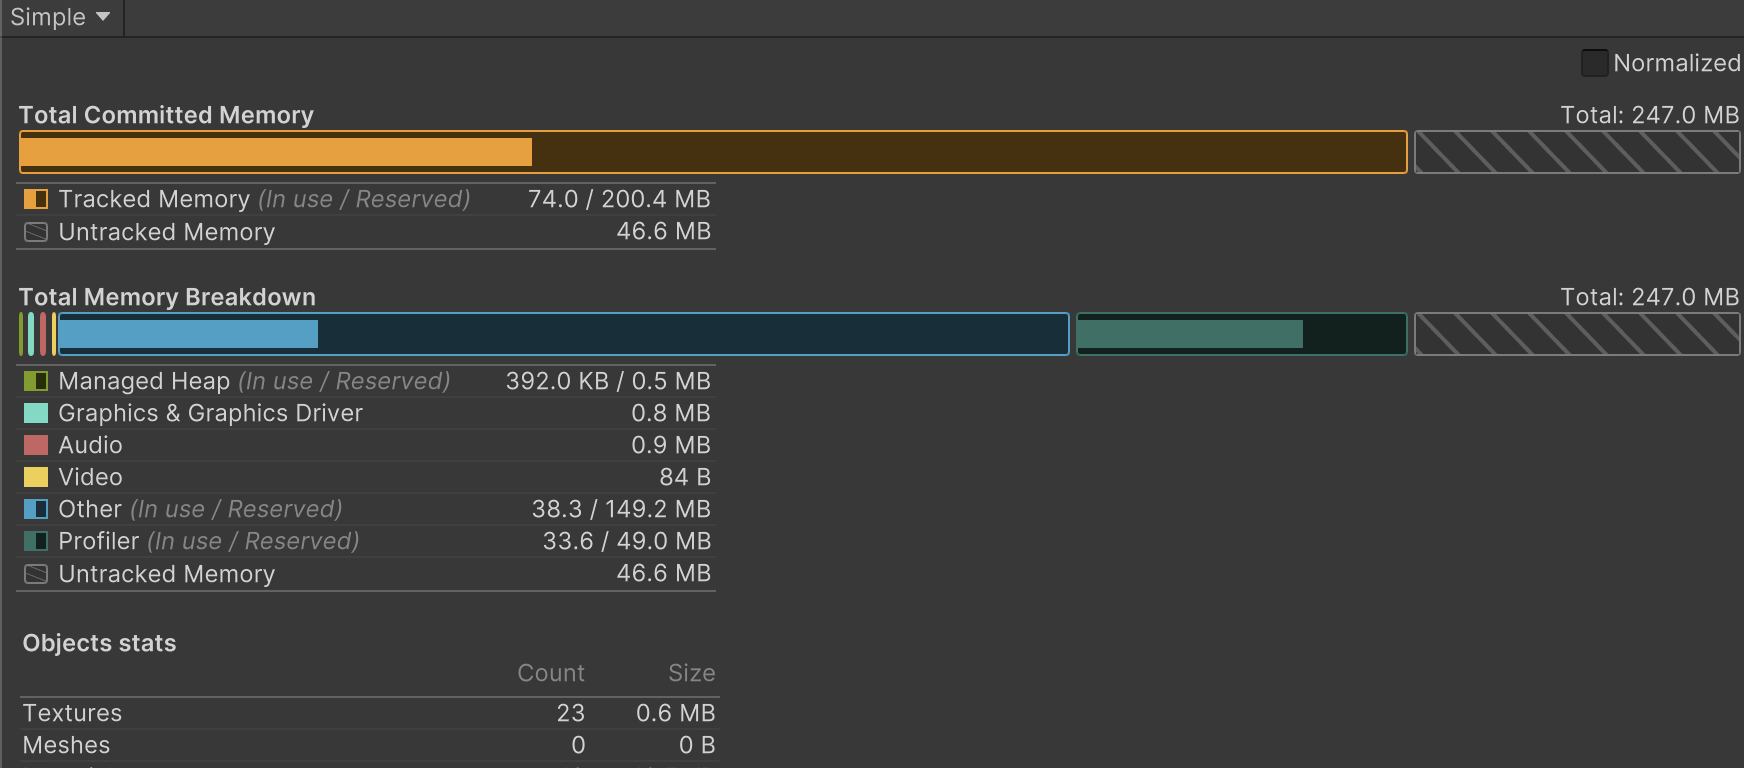
Figure 3.14: Simple View after 2021
2. Detailed view
Detailed view looks like Figure 3.15
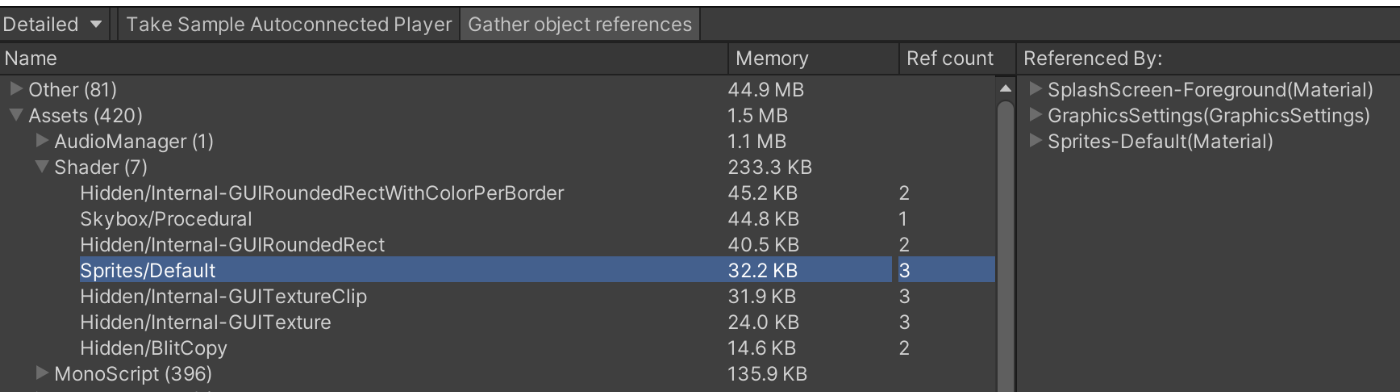
Figure 3.15: Detailed view
The result of this view can be obtained by clicking the "Take Sample" button to take a snapshot of the memory snapshot at that point in time.Unlike the Simple view, this view is not updated in real time, so if you want to refresh the view, you need to Take Sample again.
Figure 3.15 On the right side of the "Sample" button, there is an item called "Referenced By.This shows the objects that reference the currently selected object.If there are any assets that are leaking, the information of the object's references may help to solve the problem.This display is only shown if "Gather object references" is enabled.Enabling this feature will increase the processing time during Take Sample, but it is basically recommended to leave it enabled.
In Referenced By, you may see the notation ManagedStaticReferences().This means that it is referenced by some static object.If you are familiar with the project, this information may be enough to give you some idea.If not, we recommend using "3.5 Heap Explorer".
The header items of the Detailed view are not explained here, since they mean what you see.The operation is the same as "1. Hierarchy View" in "3.1.2 CPU Usage".There is a sorting function for each header, and the items are displayed in a hierarchical view.The top node displayed in the Name item is explained here.
Table 3.3: The top node of theDetailed
| Name | Description |
|---|---|
| Assets | Loaded assets not included in the scene. |
| Not Saved | Assets generated at runtime by code. For example, objects generated by code, such as new Materiala(). |
| Scene Memory | Assets contained in the loaded scene. |
| Others | Objects other than those listed above. Assignments to the various systems used by Unity. |
You may not be familiar with the items listed under Others in the top node.The following is a list of items that you should know about.
- System.ExecutableAndDlls
- Indicates the amount of allocations used for binaries, DLLs, and so on.Depending on the platform or terminal, it may not be obtainable, in which case it is treated as 0B.The memory load for theproject is not as large as the listed values, as it may be shared with other applications using a common framework.It is better to improve Asset than to rush to reduce this item.The most effective way to do this is to reduce DLLs and unnecessary scripts. The easiest way is to change the Stripping Level.However, there is a risk of missing types and methods at runtime, so debug carefully.
- SerializedFile
- Indicates meta-information such as the table of objects in the AssetBundle and the Type Tree that serves as type information.This can be released by AssetBundle.Unload(true or false).Unload(false), which releases only this meta-information after the asset is loaded, is the most efficient way.Note that if the release timing and resource reference management are not done carefully, resources can be double-loaded and memory leaks can easily occur.
- PersistentManager.Remapper
- Remapper manages the relationship between objects in memory and on disk.Be careful not to over-expand. Specifically, if a large number of AssetBundles are loaded, the mapping area will not be sufficient and will be expanded.Therefore, it is a good idea to unload unnecessary AssetBundles to reduce the number of files loaded at the same time.Also, if a single AssetBundle contains a large number of assets that are not needed on the fly, it is a good idea to split it up.Finally, we will summarize the cases in which the Detailed view is used based on what has been introduced so far.
- Detailed understanding and tuning of memory at specific timing
- Checking for unnecessary or unexpected assets
- Investigating memory leaks
3.2. Profile Analyzer
Profile Analyzer is a tool for more detailed analysis of data obtained from the Profiler's CPU Usage.While the Unity Profiler can only look at data per frame, the Profile Analyzer can obtain average, median, minimum, and maximum values based on a specified frame interval.This allows for appropriate handling of data that varies from frame to frame, making it possible to more clearly show the effects of improvement when optimization is performed.It is also a very useful tool for comparing and visualizing the results of optimization because it has a function for comparing measurement data, which CPU Usage cannot do.
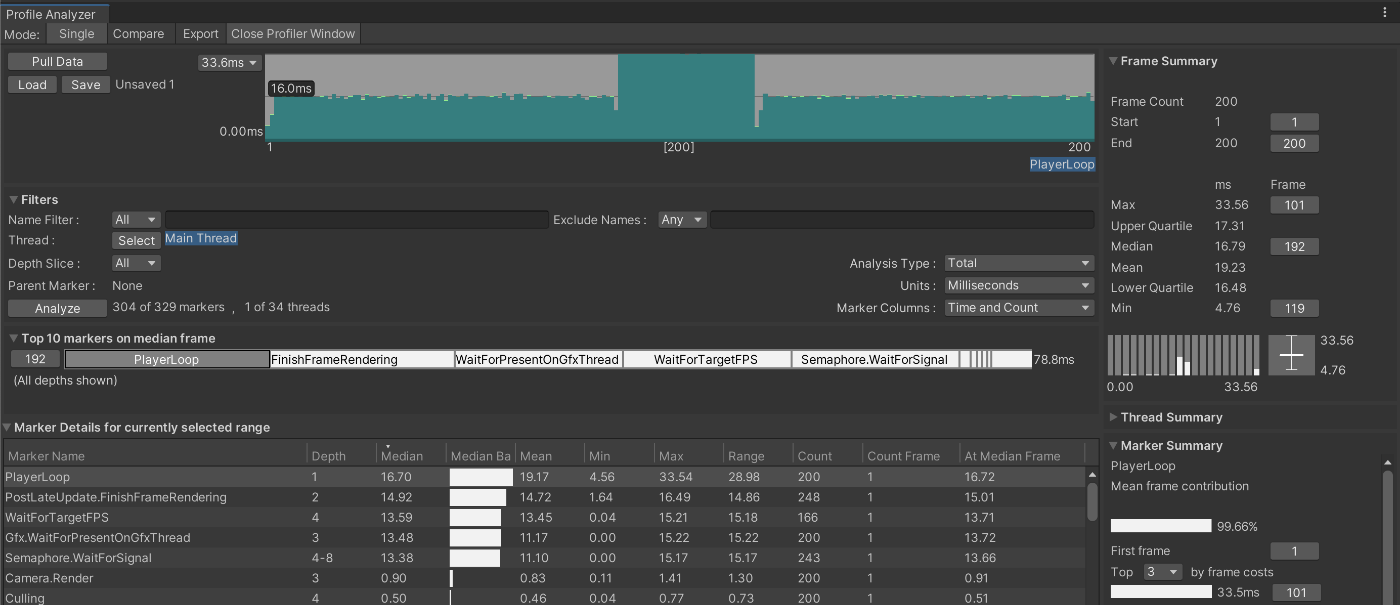
Figure 3.16: Profile Analyzer
3.2.1. How to install
This tool can be installed from the Package Manager.Since it is officially supported by Unity, change Packages to Unity Registry and type "Profile" in the search box.After installation, you can start the tool by selecting "Window -> Analysis -> Profile Analyzer".
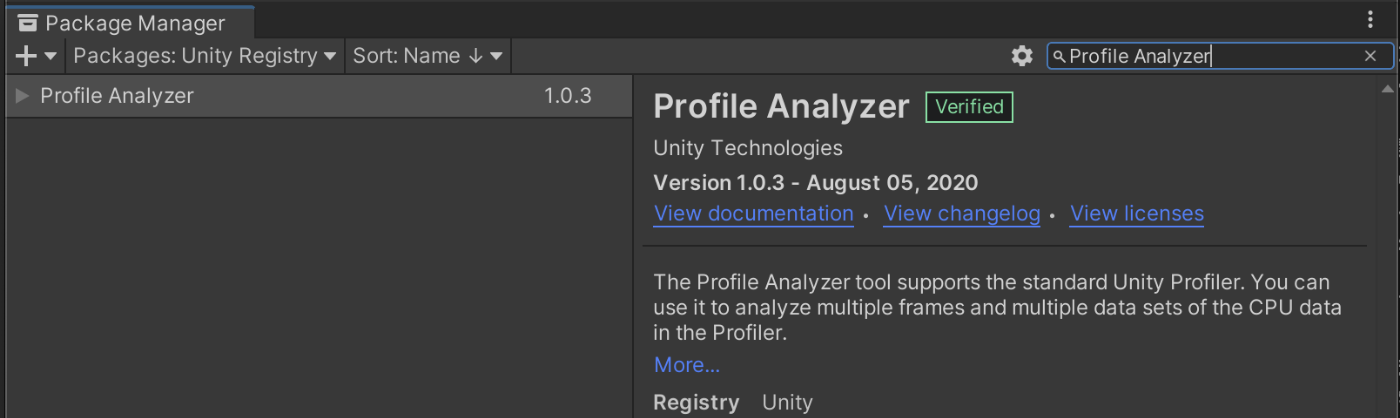
Figure 3.17: Installation from PackageManager
3.2.2. How to operate
Profile Analyzer looks like Figure 3.18 right after startup.
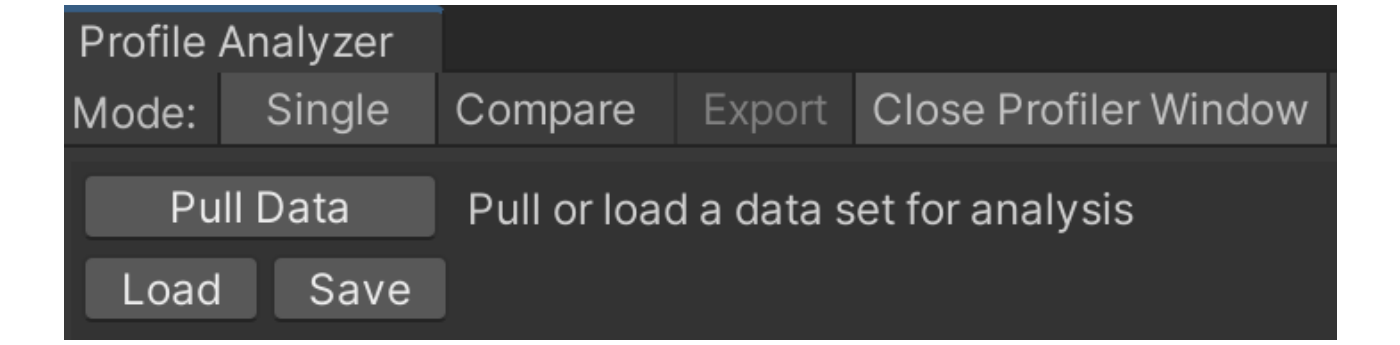
Figure 3.18: Immediately after startup
There are two modes of functionality: "Single" and "Compare".Single mode is used to analyze a single measurement data, while Compare mode is used to compare two measurement data.
Pull Data" allows you to analyze data measured with the Unity Profiler and display the results.The "Pull Data" mode allows you to analyze the data measured in the Unity Profiler and display the results.
Save" and "Load" allow you to save and load the data analyzed by Profile Analyzer.Of course, there is no problem if you keep only the Unity Profiler data.In that case, you need to load the data in Unity Profiler and do Pull Data in Profile Analyzer each time.If this procedure is troublesome, it is better to save the data as a dedicated data.
3.2.3. Analysis Result (Single mode)
The analysis result screen is structured as follows.The word "marker" appears here, but it refers to the name of the process (method name).
- Analysis section setting screen
- Screen for inputting filters for display items
- Top 10 median values of markers
- Analysis result of marker
- Frame Summary
- Thread Summary
- Summary of selected markers
Let's take a look at each of these display screens.
1. analysis section setting screen
The processing time for each frame is displayed, with all frames initially selected.The frame interval can be changed by dragging like Figure 3.19, so adjust it if necessary.
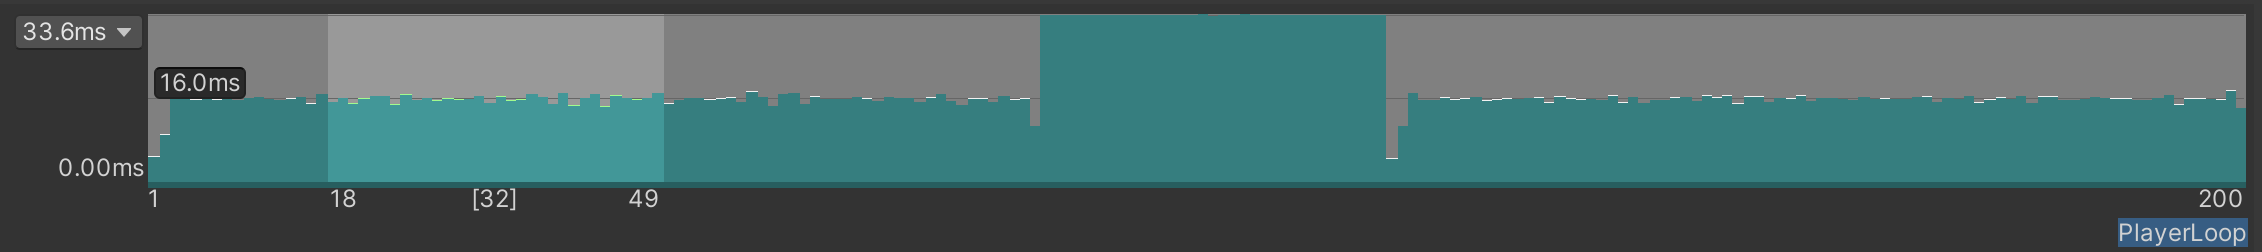
Figure 3.19: Specifying a frame interval
2. filter input screen
The filter input screen allows filtering of analysis results.
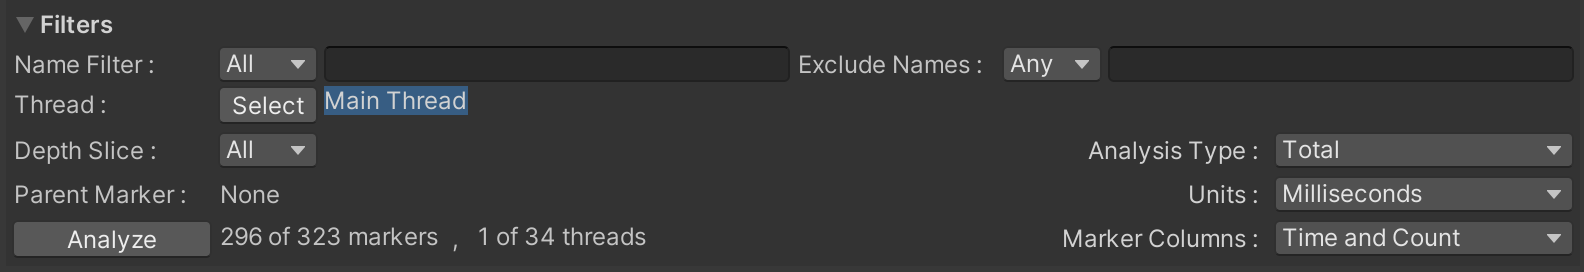
Figure 3.20: Filter Input Screen
Each item is as follows.
Table 3.4: Items of Filters
| Item Name | Description |
|---|---|
| Name Filter | Filter by the name of the process you want to search. |
| Exclude Filter | Filter by the name of the process you want to exclude from the search. |
| Thread | The selected threads will be displayed in the analysis results. If you need information on other threads, add them. |
| Depth Slice | This is the number of slice in the Hierarchy in CPU Usage. For example, if Depth is 3, the third hierarchy is displayed. |
| Analysis Type | Total and Self can be switched. This is the same as the header item introduced in CPU Usage. |
| Units | Time display can be changed to milliseconds or microseconds. |
| Marker Columns | Change the header display of analysis results. |
When Depth Slice is set to All, the top node called PlayerLoop is displayed, or different layers of the same process are displayed, which can be difficult to see.In such cases, it is recommended to fix Depth to 2~3 and set it so that subsystems such as rendering, animation, and physics are displayed.
3) Top 10 Median Marker Values
This screen shows only the top 10 markers sorted by the median processing time for each marker.You can see at a glance how much processing time each of the top 10 markers occupies.

Figure 3.21: Median of Top 10 markers
4. analysis results of markers
The analysis results of each marker are displayed.It is a good idea to analyze the process that should be improved based on the process name listed in Marker Name and the values of Median and Mean.If you move the mouse pointer over a header item, a description of the item will be displayed, so please refer to it if you do not understand the content.
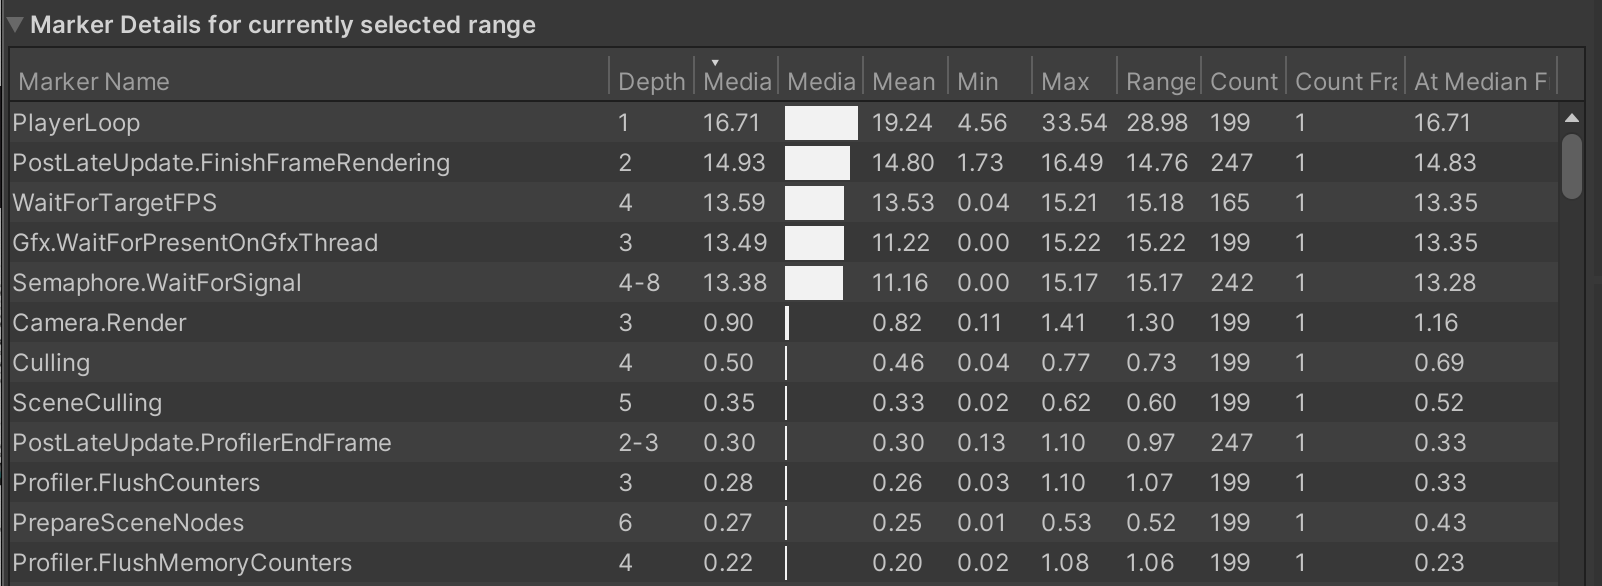
Figure 3.22: Analysis results for each process
Mean and Median
The mean is the value obtained by adding all values together and dividing by the number of data.The median, on the other hand, is the value that lies in the middle of the sorted data. In the case of an even number of data, the average value is taken from the data before and after the median.
The average has the property that it is susceptible to data with values that are extremely far apart.If there are frequent spikes or the sampling number is not sufficient, it may be better to refer to the median.
Figure 3.23 is an example of a large difference between the median and the mean.
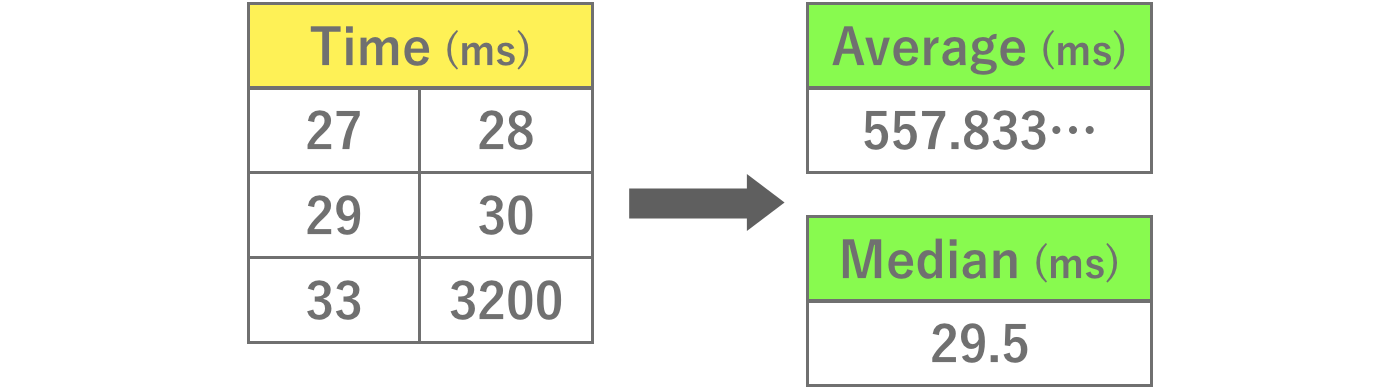
Figure 3.23: Median and Mean
Analyze your data after knowing the characteristics of these two values.
5. frame summary
This screen shows the frame statistics of the measured data.
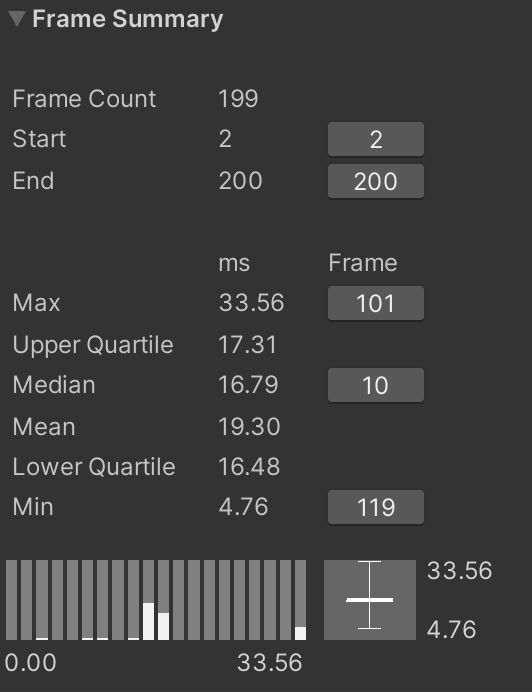
Figure 3.24: Frame Summary Screen
This screen displays interval information for the frame being analyzed and the degree of variation in the values using a boxplot or histogram.Box plots require an understanding of quartiles.Quartiles are defined values with the data sorted as Table 3.5.
Table 3.5: Quartiles
| Name | Description |
|---|---|
| Minimum value (Min) | Minimum value |
| Lower Quartile | Value located 25% of the way from the minimum |
| Median | The value located at the 50% position from the minimum |
| Upper Quartile | Value in the 75th percentile from the minimum |
| Maximum Value (Max) | Maximum value |
The interval between 25% and 75% is boxed, which is called a box-and-whisker graph.

Figure 3.25: Box-and-whisker graph
The histogram shows processing time on the horizontal axis and the number of data on the vertical axis, which is also useful for viewing data distribution.In the frame summary, you can check the interval and the number of frames by hovering the cursor over them.

Figure 3.26: Histograms
After understanding how to see these diagrams, it is a good idea to analyze the features.
6. thread summary
This screen shows statistics for the selected thread.You can see a box-and-whisker diagram for each thread.
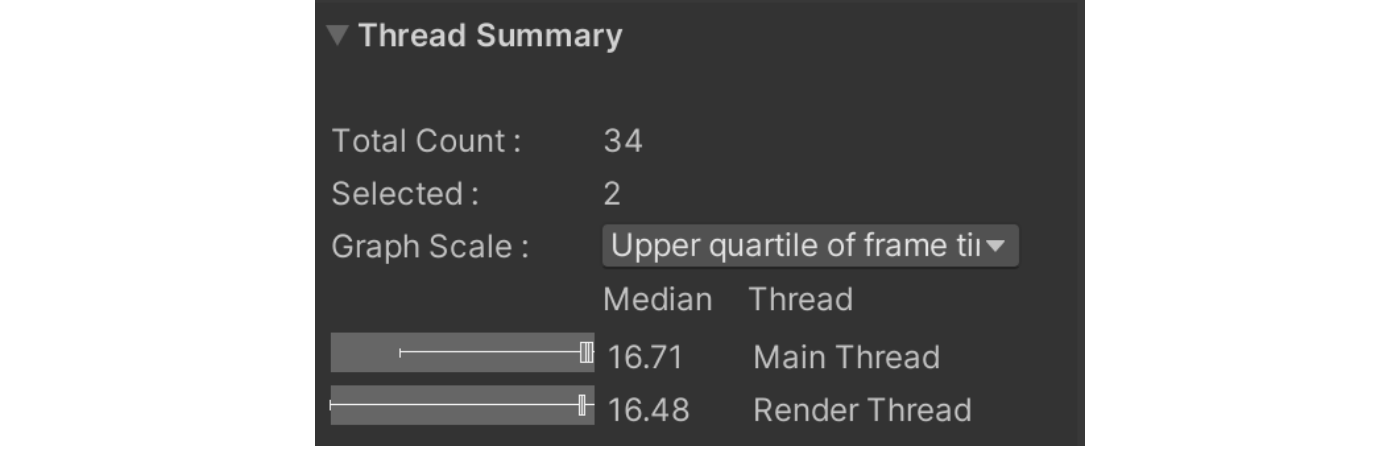
Figure 3.27: Frame Summary Screen
7. summary of the currently selected marker
This is a summary of the marker selected on the "4. analysis results of markers" screen.The processing time for the currently selected marker is shown in a box-and-whisker diagram or histogram.
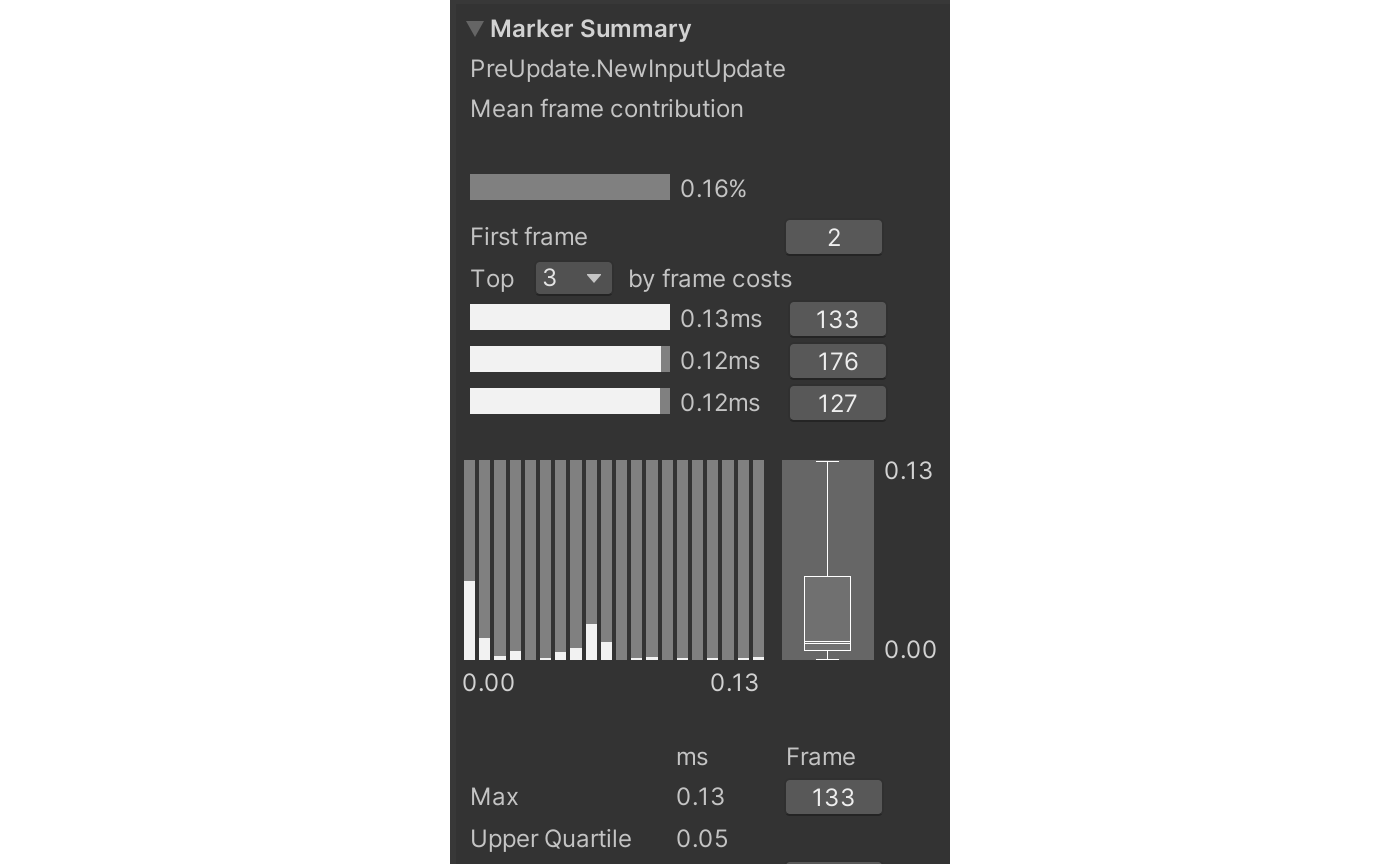
Figure 3.28: Summary of selected markers
3.2.4. Analysis results (Compare mode)
In this mode, two sets of data can be compared.The interval to be analyzed can be set for each of the upper and lower data.
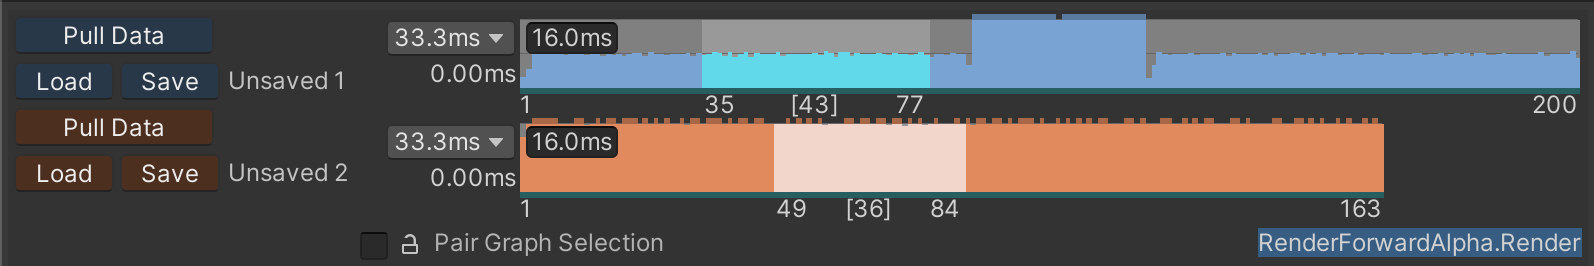
Figure 3.29: Comparison data settings
The usage of the screen is almost the same as Single mode, but the words "Left" and "Right" appear in various screens like Figure 3.30.
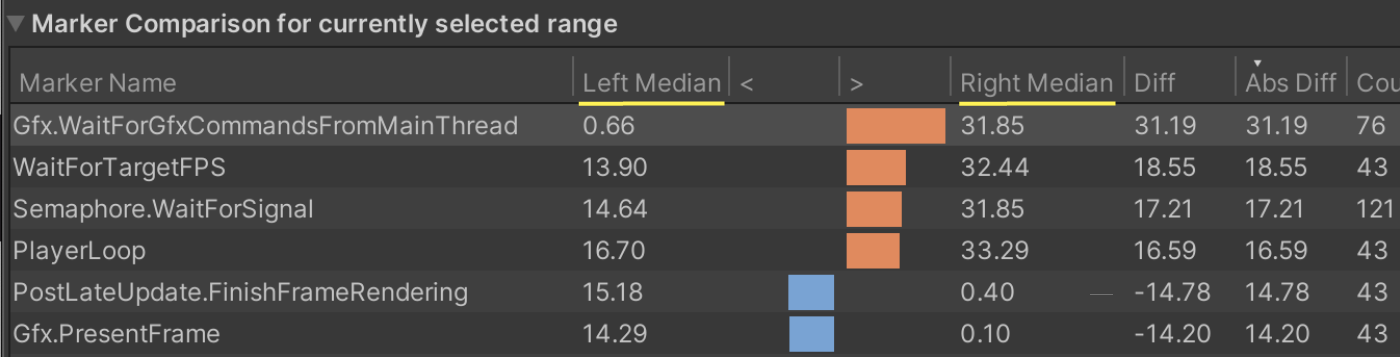
Figure 3.30: Comparison of markers
This shows which data is which, and matches the color shown at Figure 3.29.Left is the top data and Right is the bottom data.This mode will make it easier to analyze whether the tuning results are good or bad.
3.3. Frame Debugger
The Frame Debugger is a tool that allows you to analyze how the currently displayed screen is rendered.This tool is installed by default in the editor and can be opened by selecting "Window -> Analysis -> Frame Debugger".
It can be used in the editor or on the actual device.When using it on an actual device, a binary built with "Development Build" is required, as is the Unity Profiler.Start the application, select the device connection, and press "Enable" to display the drawing instruction.
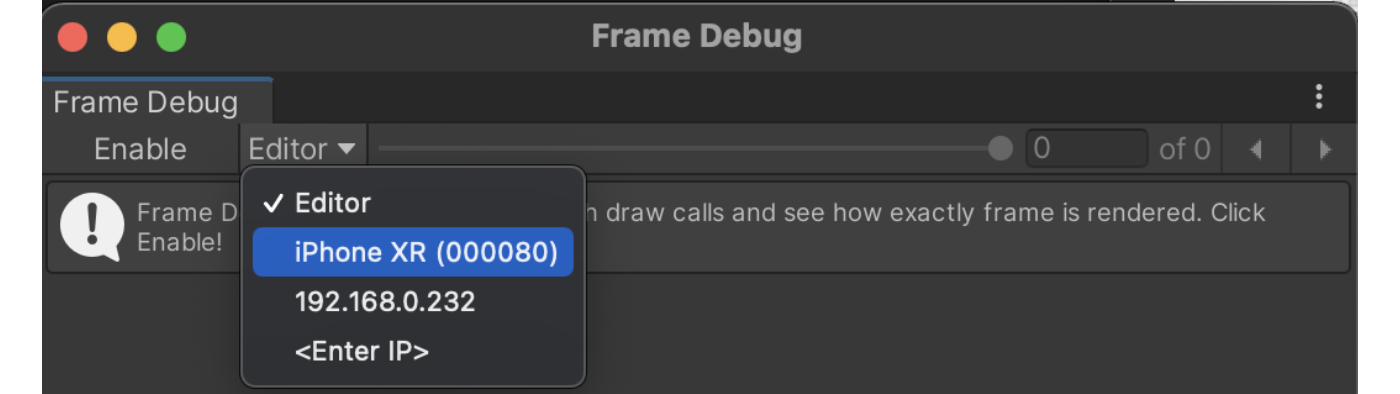
Figure 3.31: FrameDebugger connection screen
3.3.1. Analysis screen
Click "Enable" to display the following screen.
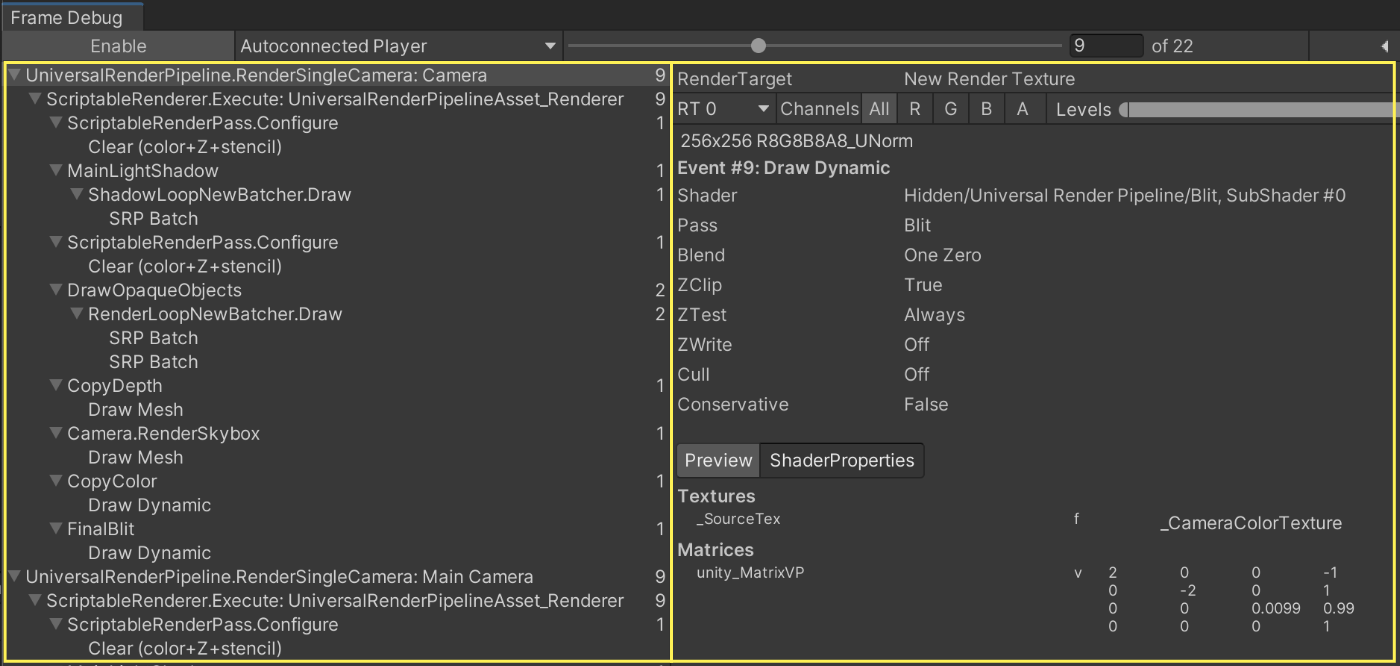
Figure 3.32: FrameDebugger Capture
The left frame shows a single drawing instruction per item, with the instructions issued in order from top to bottom.The right frame shows detailed information about drawing instructions. You can see which Shader was processed with what properties.While looking at this screen, analyze with the following in mind.
- Are there any unnecessary instructions?
- Whether drawing batching is working properly or not
- Is the resolution of the drawing target too high?
- Is an unintended Shader being used?
3.3.2. Detailed Screen
The contents of the right frame of Figure 3.32 introduced in the previous section are explained in detail.
Operation Panel
First, let's look at the operation panel in the upper section.

Figure 3.33: Operation panel in the upper section
The part marked "RT0" can be changed when there are multiple render targets.This is especially useful when using multiple render targets to check the rendering status of each target.Channels can be changed to display all RGBA or only one of the channels.Levels is a slider that allows you to adjust the brightness of the resulting rendering.This is useful, for example, to adjust the brightness of a dark rendering, such as ambient or indirect lighting, to make it easier to see.
Drawing Overview
This area provides information on the resolution and format of the destination. Obviously, you will be able to notice immediately if there is a drawing destination with a higher resolution.Other information such as the Shader name used, Pass settings such as Cull, and keywords used can also be found.The sentence "Why this~" listed at the bottom describes why the drawing could not be batching.Figure 3.34 In the case of "Why this~," it states that the first drawing call was selected and therefore batching was not possible.Since the causes are described in such detail, you can rely on this information to make adjustments if you want to devise batching.
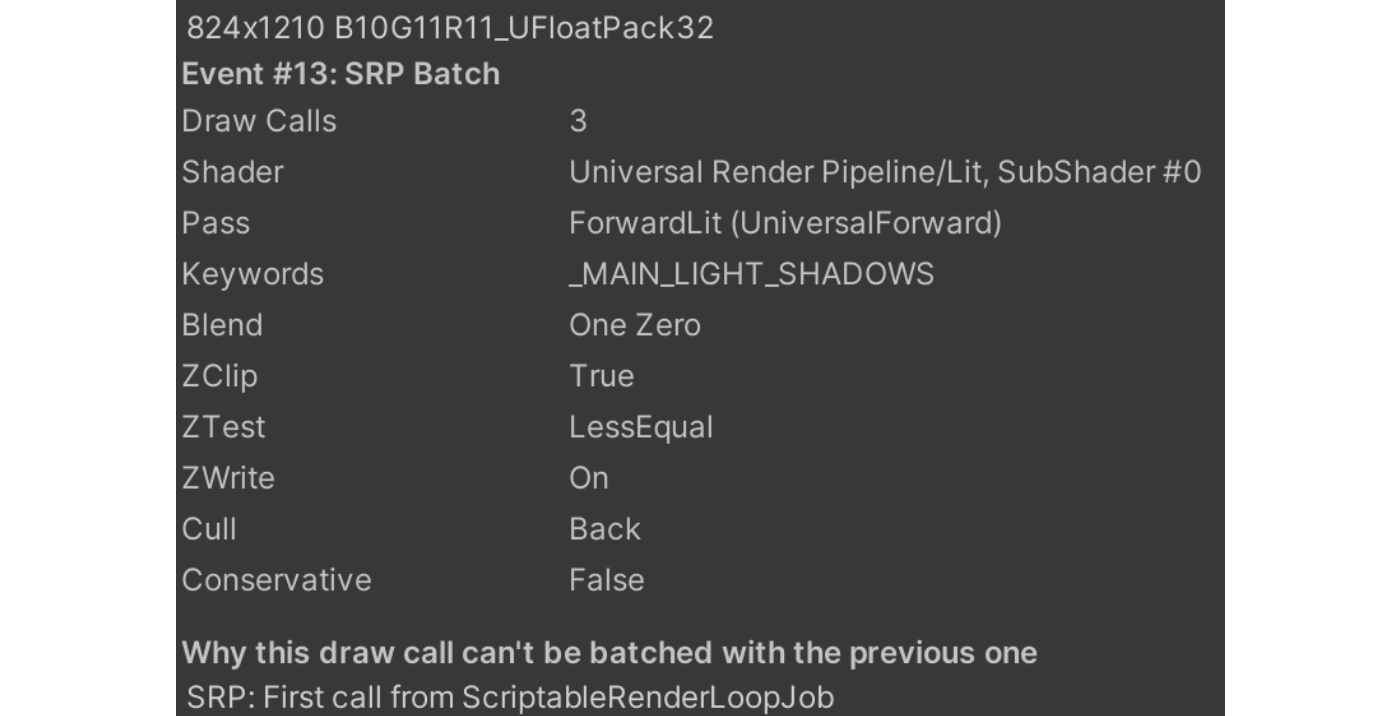
Figure 3.34: Overview of the middle drawing
Detailed information on the Shader property
This area describes the property information of the Shader being drawn.This is useful for debugging.
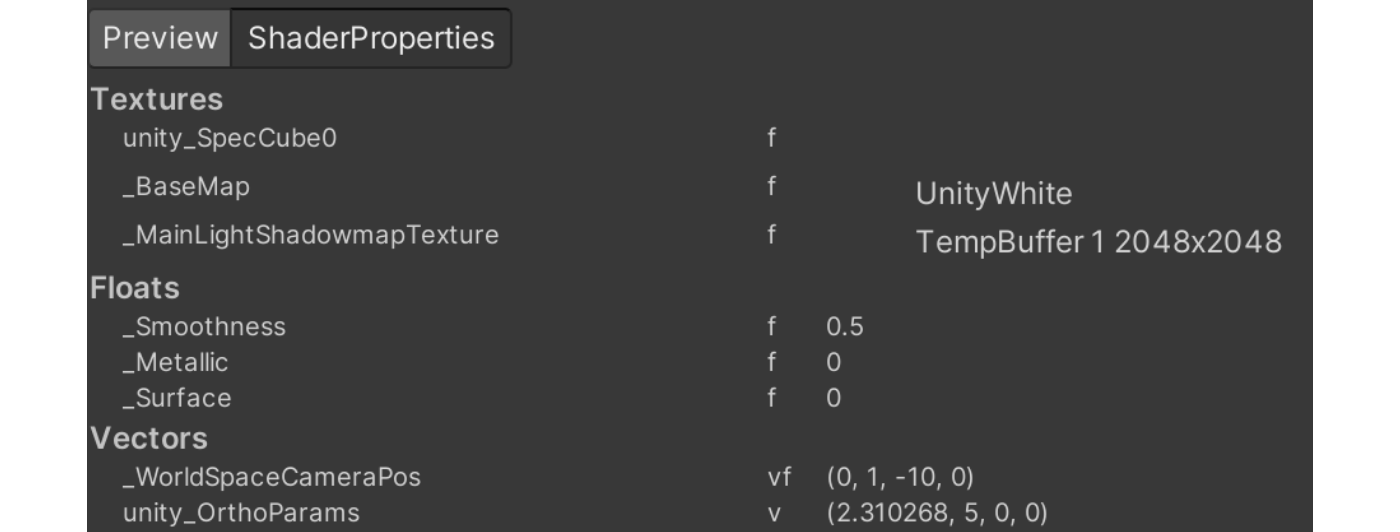
Figure 3.35: Detailed information on Shader properties in the lower row
Sometimes it is necessary to check in detail the state of Texture2D displayed in the property information.To do so, click on the image while holding down the Command key on a Mac (Control key on Windows) to enlarge the image.
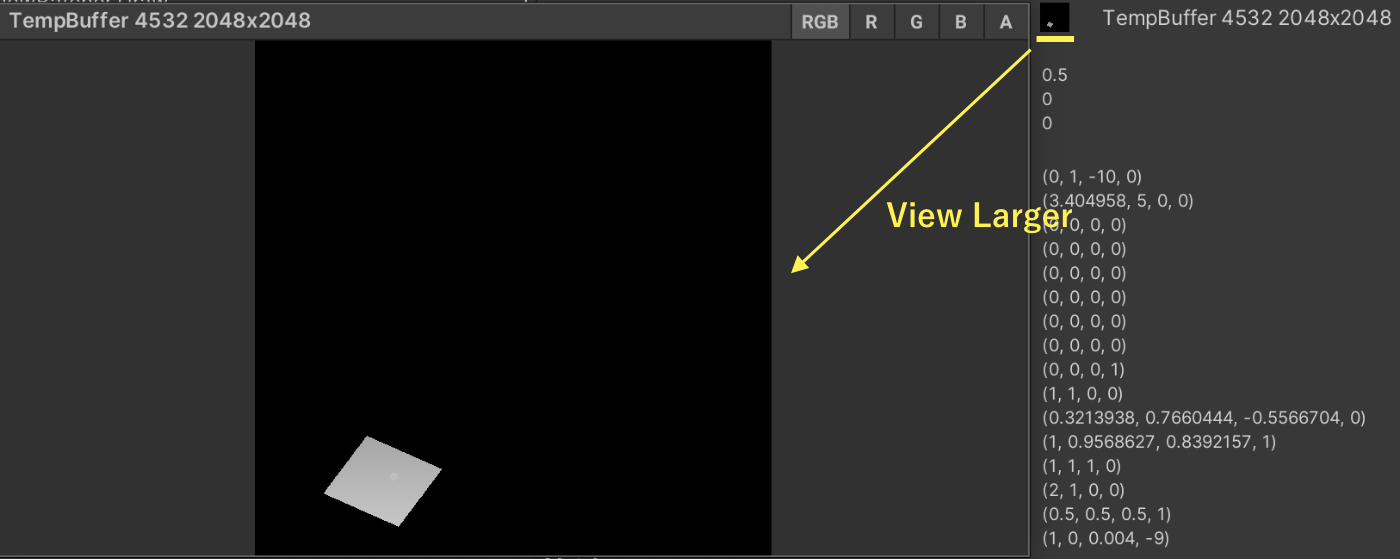
Figure 3.36: Enlarge Texture2D preview
3.4. Memory Profiler
Memory Profiler is an official tool provided by Unity as a Preview Package.Compared to the Memory module of the Unity Profiler, it is superior in the following main points.
- Captured data is saved locally with screenshots
- The amount of memory occupied by each category is visualized and easy to understand
- Data can be compared
The UI of the Memory Profiler has changed significantly between v0.4 and later versions.This book uses v0.5, which is the latest version at the time of writing.For v0.4 or later versions, Unity 2020.3.12f1 or later version is required to use all features.In addition, v0.4 and v0.5 look the same at first glance, but v0.5 has been significantly updated.In particular, object references are now much easier to follow, so we basically recommend using v0.5 or later.
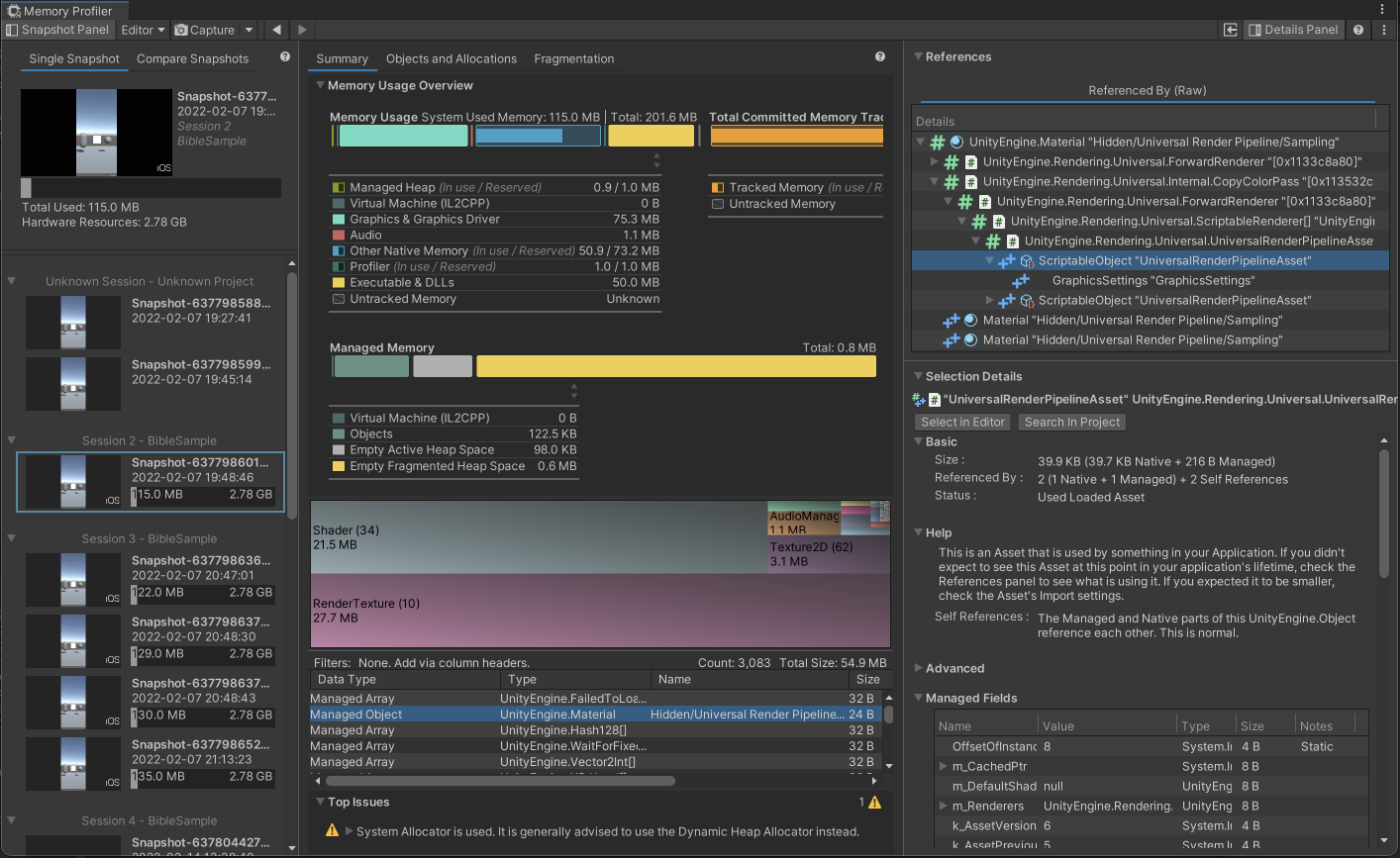
Figure 3.37: Memory Profiler
3.4.1. How to install
In Unity 2020, you need to enable "Enable Preview Packages" in "Project Settings -> Package Manager" for the Preview version packages.
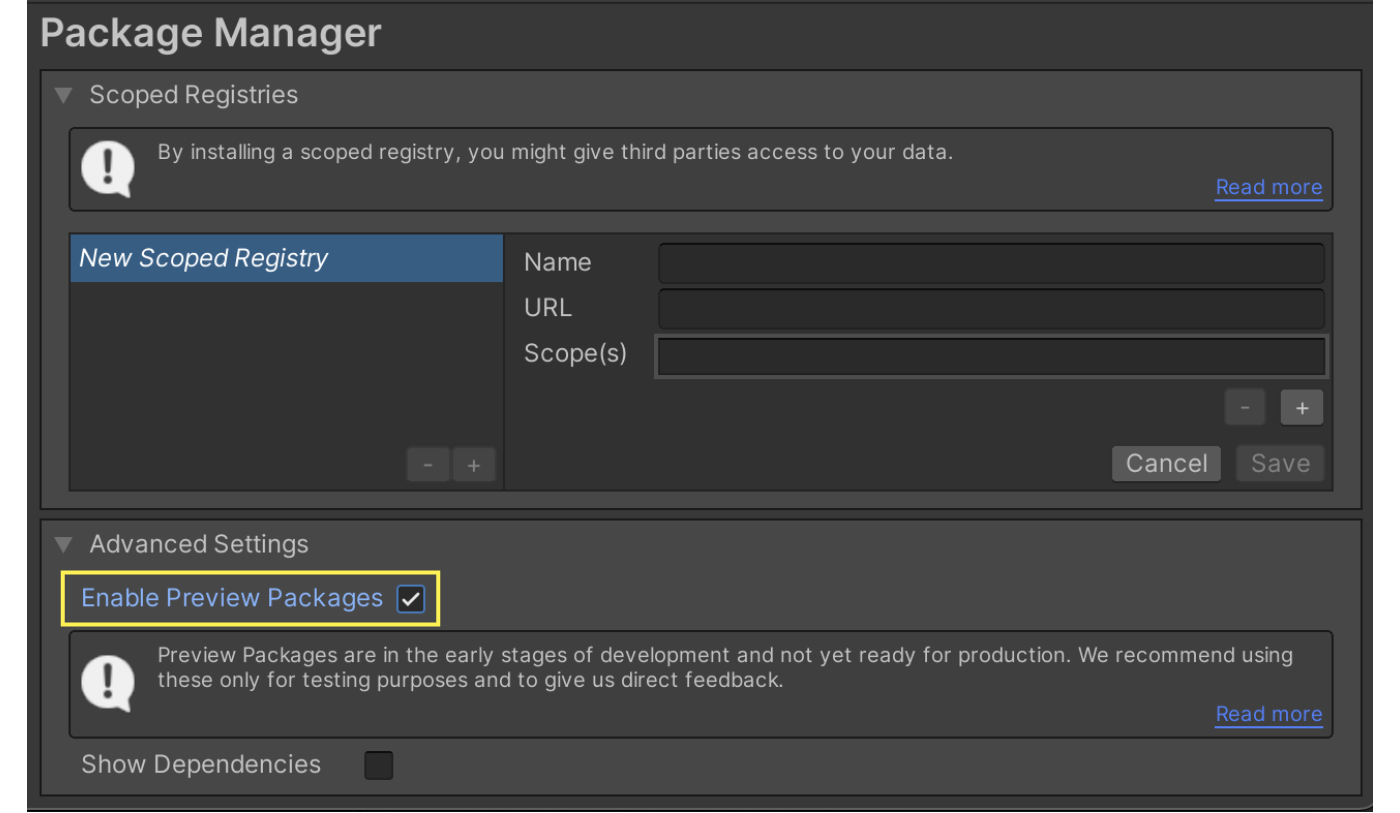
Figure 3.38: Enable Preview Packages
Then install the Memory Profiler from Package in the Unity Registry.After installation, go to "Window -> Analysis -> Memory Profiler" to launch the tool.
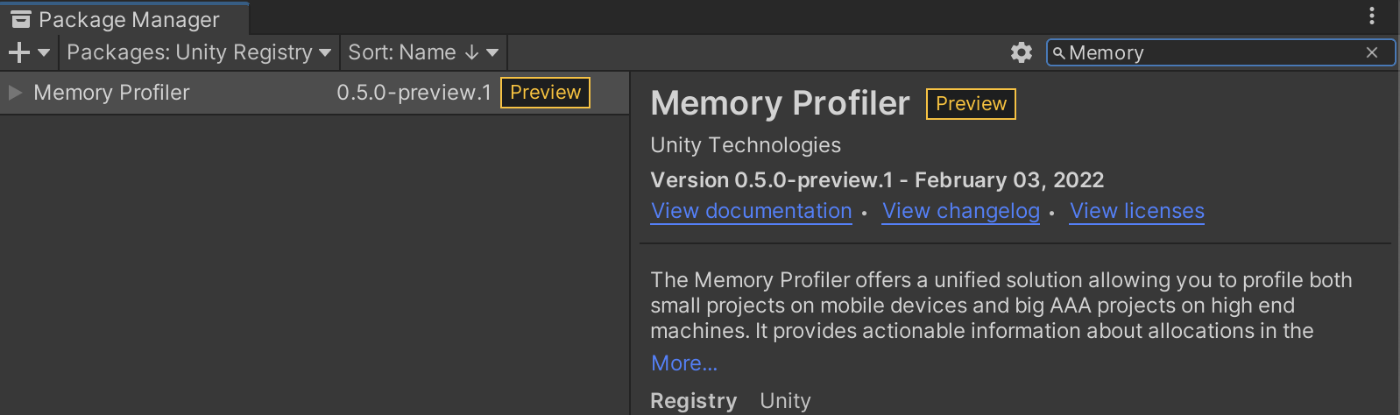
Figure 3.39: Install from PackageManager
In Unity 2021 and later, the method of adding packages has been changed.To add a package, click on "Add Package by Name" and enter "com.unity.memoryprofiler".
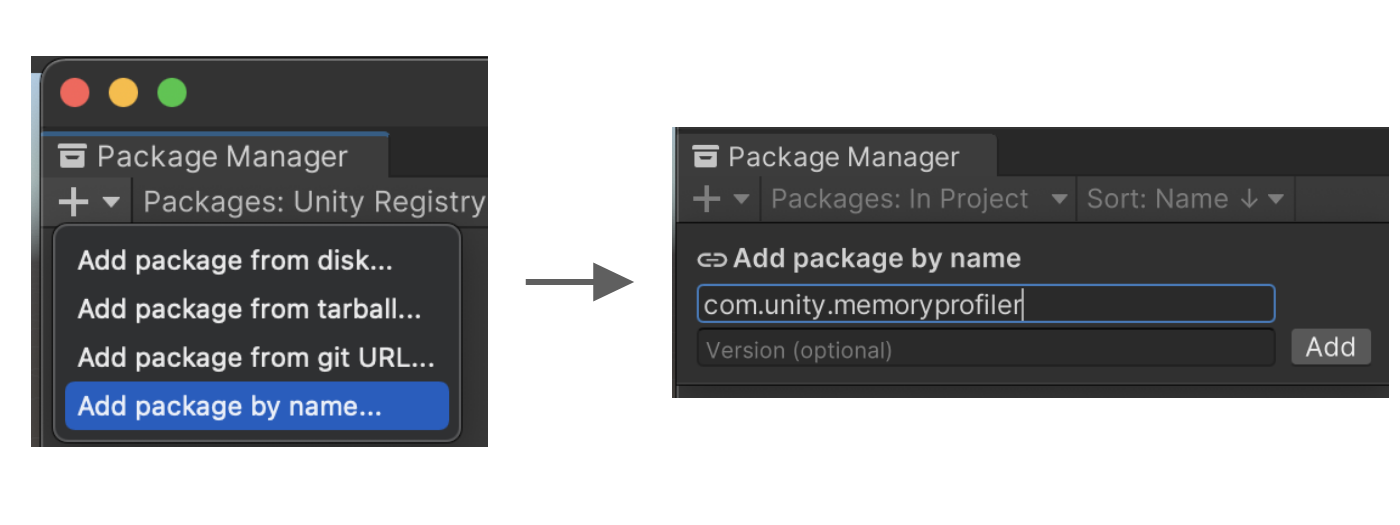
Figure 3.40: How to add after 2021
3.4.2. How to Operate
Memory Profiler consists of four major components.
- Toolbar
- Snapshot Panel
- Measurement Results
- Detail Panel
Explanations are given for each area.
1. tool bar
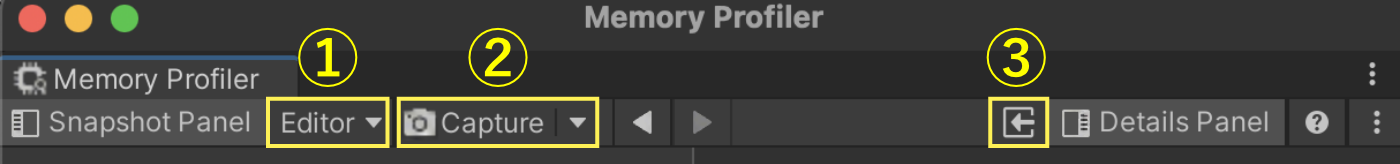
Figure 3.41: Toolbar area
Figure 3.41 indicates a capture of the Header.The button ① allows you to select the measurement target.The button (2) measures the memory at the time when it is pressed. Optionally, you can choose to measure only Native Objects or disable screenshots.The basic default settings should be fine.Clicking the button (③) will load the measured data.Clicking the "Snapshot Panel" or "Detail Panel" button will show or hide the information panels on the left and right sides of the screen.If you only want to see the tree map, it is better to hide them.You can also click the "? to open the official document.
There is one important point to note regarding the measurement.One thing to note about measurement is that the memory required for measurement is newly allocated and will not be released again.However, it does not increase infinitely and will eventually settle down after several measurements. The amount of memory allocated at measurement time will depend on the complexity of the project.If you do not know this assumption, be careful because you may mistakenly think there is a leak when you see the amount of memory usage ballooning.
Snapshot Panel
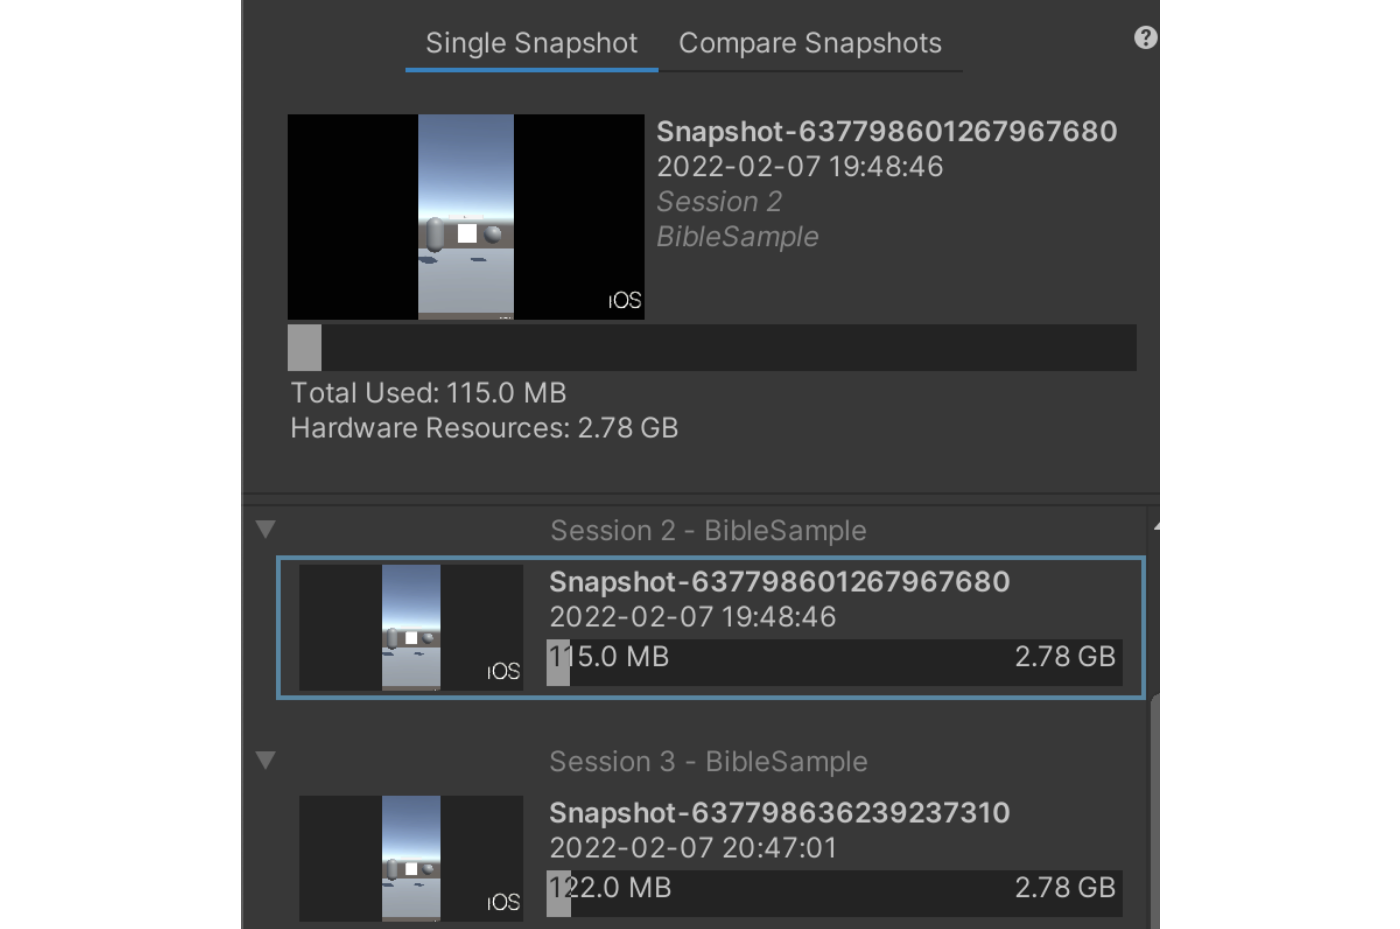
Figure 3.42: Snapshot Panel (Single)
The Snapshot Panel displays the measured data and allows you to choose which data to view.The data is organized by session, from the time the application is launched to the time it is terminated.You can also delete or rename the measured data by right-clicking on it.
Single Snapshot" and "Compare Snapshots" are available at the top.Clicking "Compare Snapshots" changes the display to a UI for comparing measurement data.
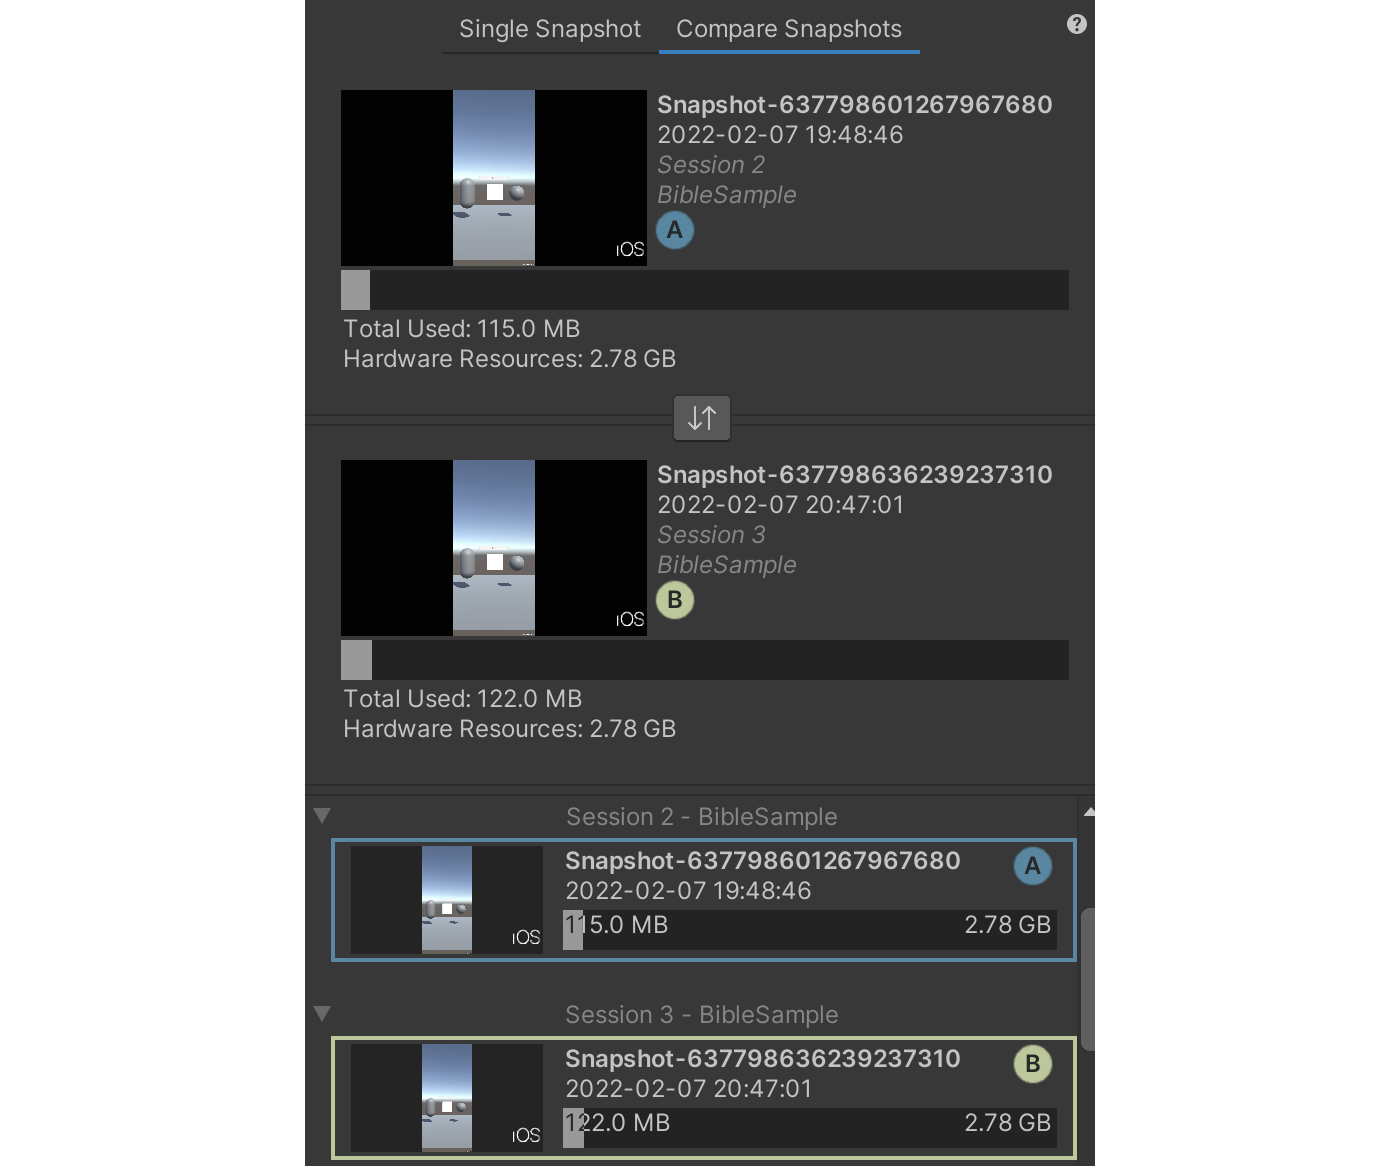
Figure 3.43: Snapshot Panel (Comapre)
A" is the data selected in Single Snapshot and "B" is the data selected in Compare Snapshots.By clicking on the "Replace" button, "A" and "B" can be switched without returning to the Single Snapshot screen.
3. measurement results
There are three tabs for measurement results: "Summary," "Objects and Allocations," and "Fragmentation.This section describes Summary, which is frequently used, and briefly describes the other tabs as supplementary information.The upper part of the Summary screen is an area called Memory Usage Overview, which displays an overview of the current memory.Clicking on an item displays an explanation in the Detail Panel, so it is a good idea to check items you do not understand.
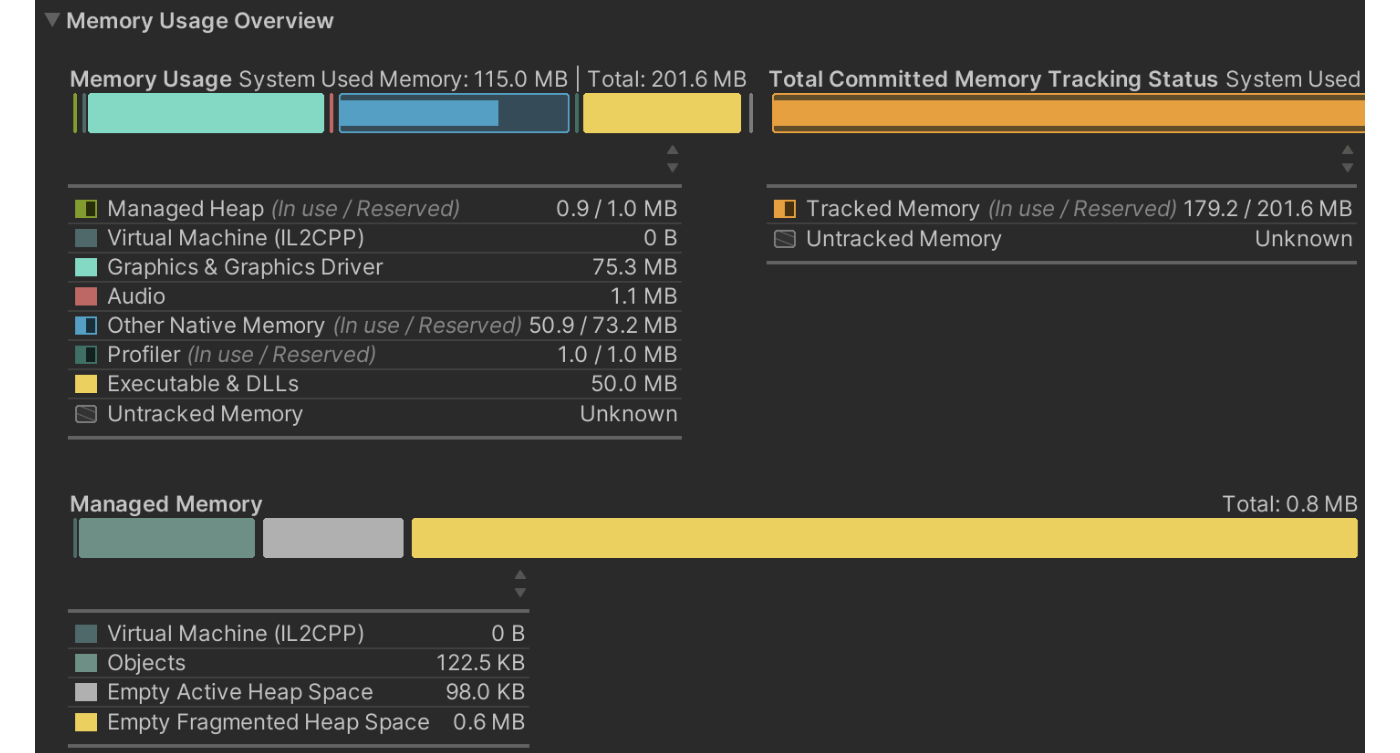
Figure 3.44: Memory Usage Overview
The next area of the screen is called the Tree Map, which graphically displays memory usage for each category of objects.By selecting each category, you can check the objects within the category.Figure 3.45 In the following example, the Texture2D category is selected.
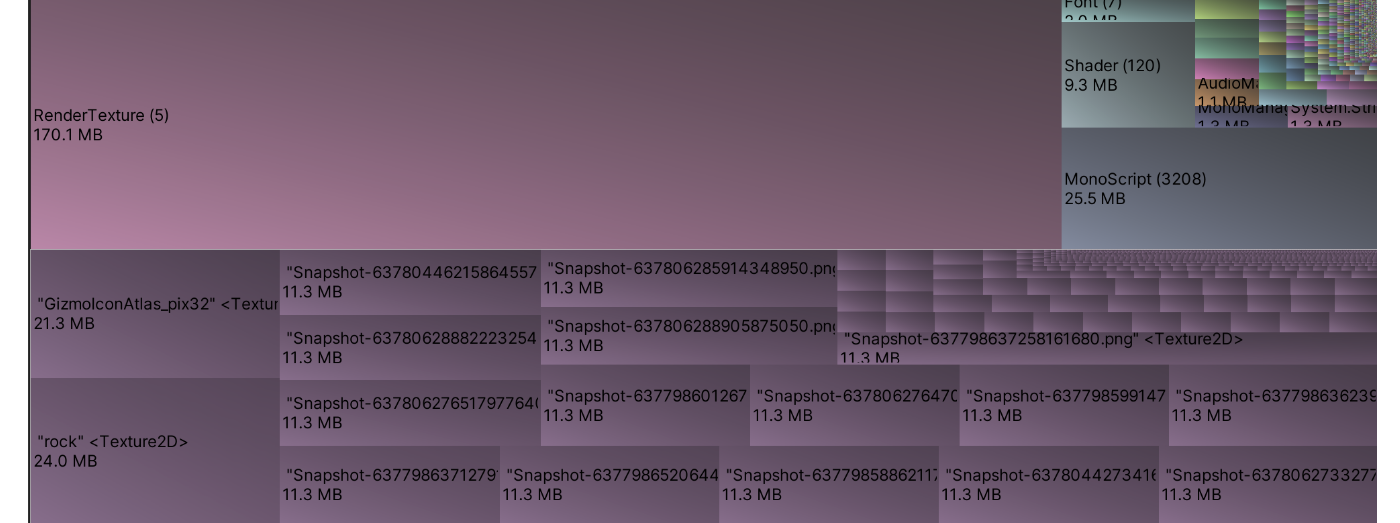
Figure 3.45: Tree Map
The bottom part of the screen is called Tree Map Table. Here, the list of objects is arranged in a table format.The displayed items can be grouped, sorted, and filtered by pressing the header of the Tree Map Table.

Figure 3.46: Header Operations
Especially, grouping the Types makes it easier to analyze, so please use it proactively.
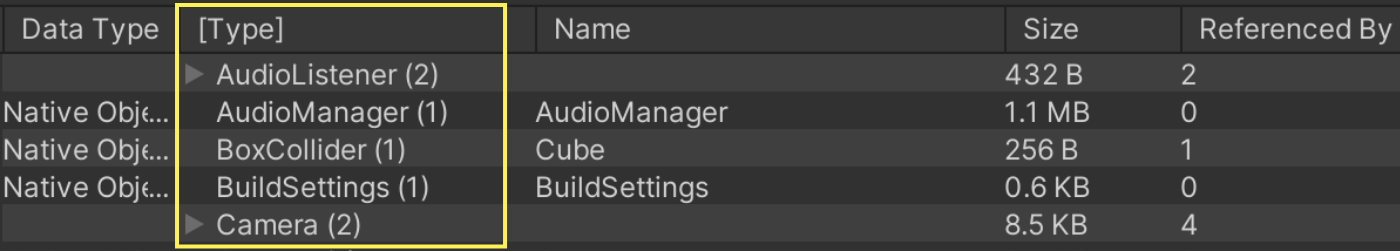
Figure 3.47: Grouping by Type
When a category is selected in the Tree Map, a filter is automatically set to display only objects in that category.
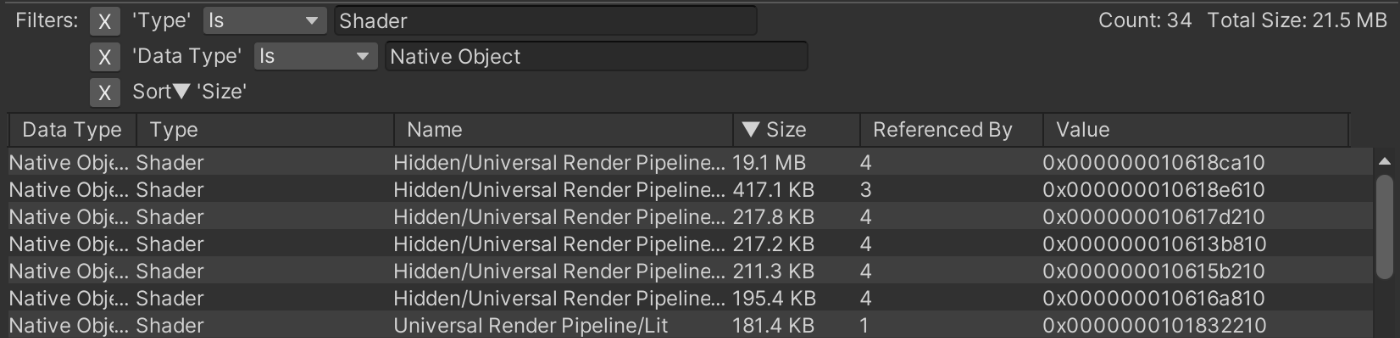
Figure 3.48: Automatic Filter Settings
Finally, the UI changes when Compare Snapshots is used.Memory Usage Overview displays the differences for each object.
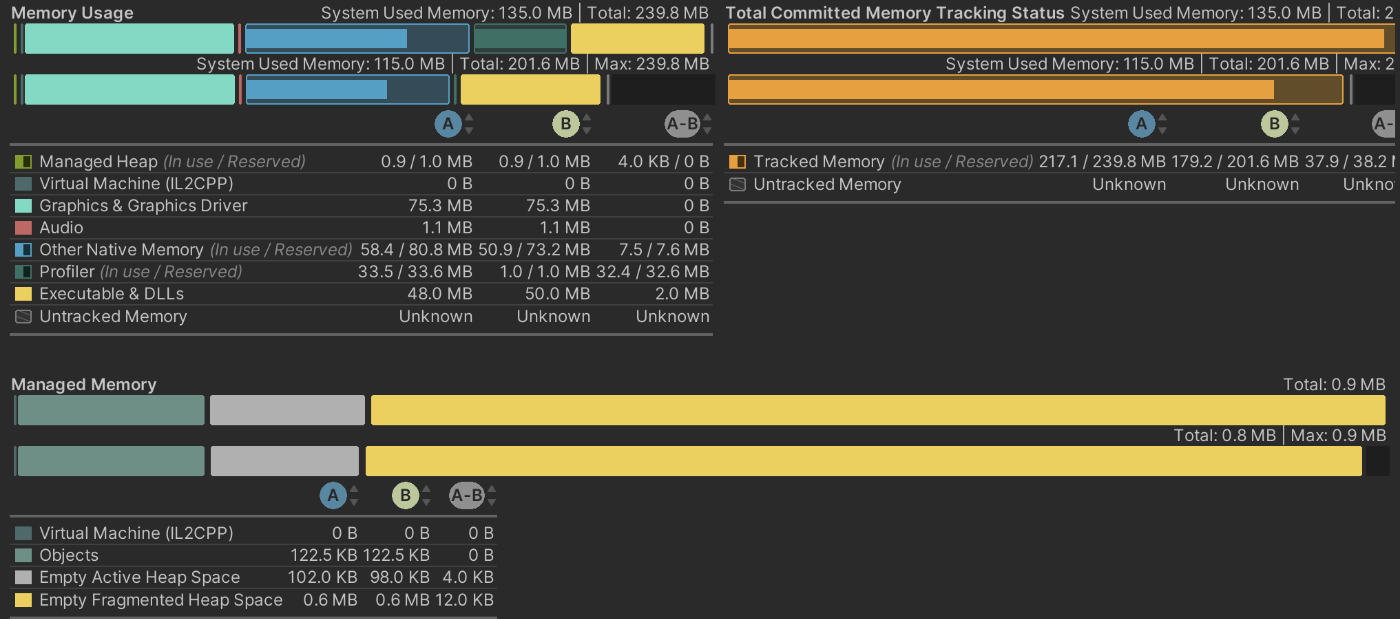
Figure 3.49: Memory Usage Overview in Compare Snapshots
In the Tree Map Table, a Diff item is added to the Header.Diffs can be of the following types
Table 3.6: Tree Map Table (Compare)
| Diff | Description |
|---|---|
| Same | A, B same object |
| Not in A (Deleted) | Object in A but not in B |
| Not in B (New) | Object not in A but in B |
By looking at this information, it is possible to check whether memory is increasing or decreasing.
Detail Panel
This panel is used when you want to track the reference relationship of the selected object.By checking this Referenced By, you will be able to figure out what is causing the continued reference grabbing.
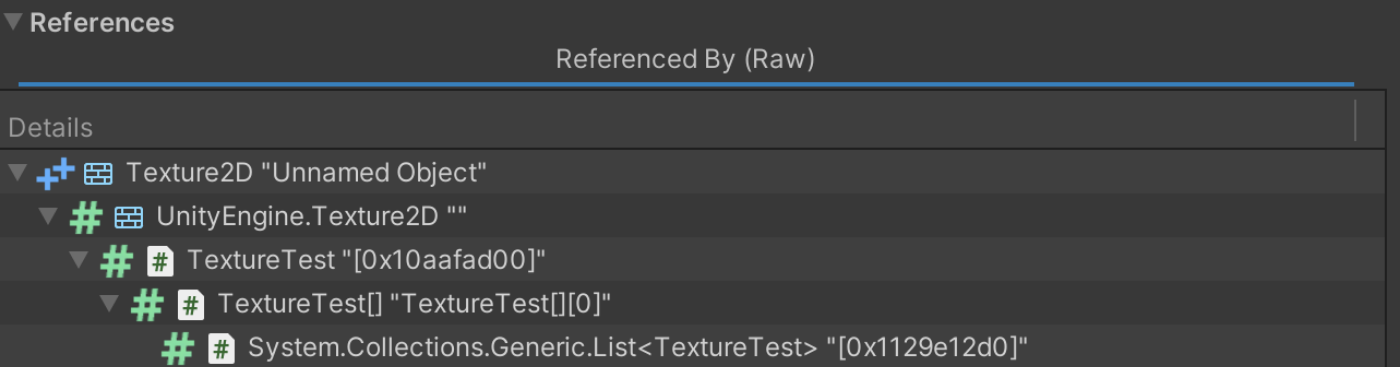
Figure 3.50: Referenced By
The bottom section, Selection Details, contains detailed information about the object.Among them, the "Help" section contains advice on how to release it.You may want to read it if you are not sure what to do.
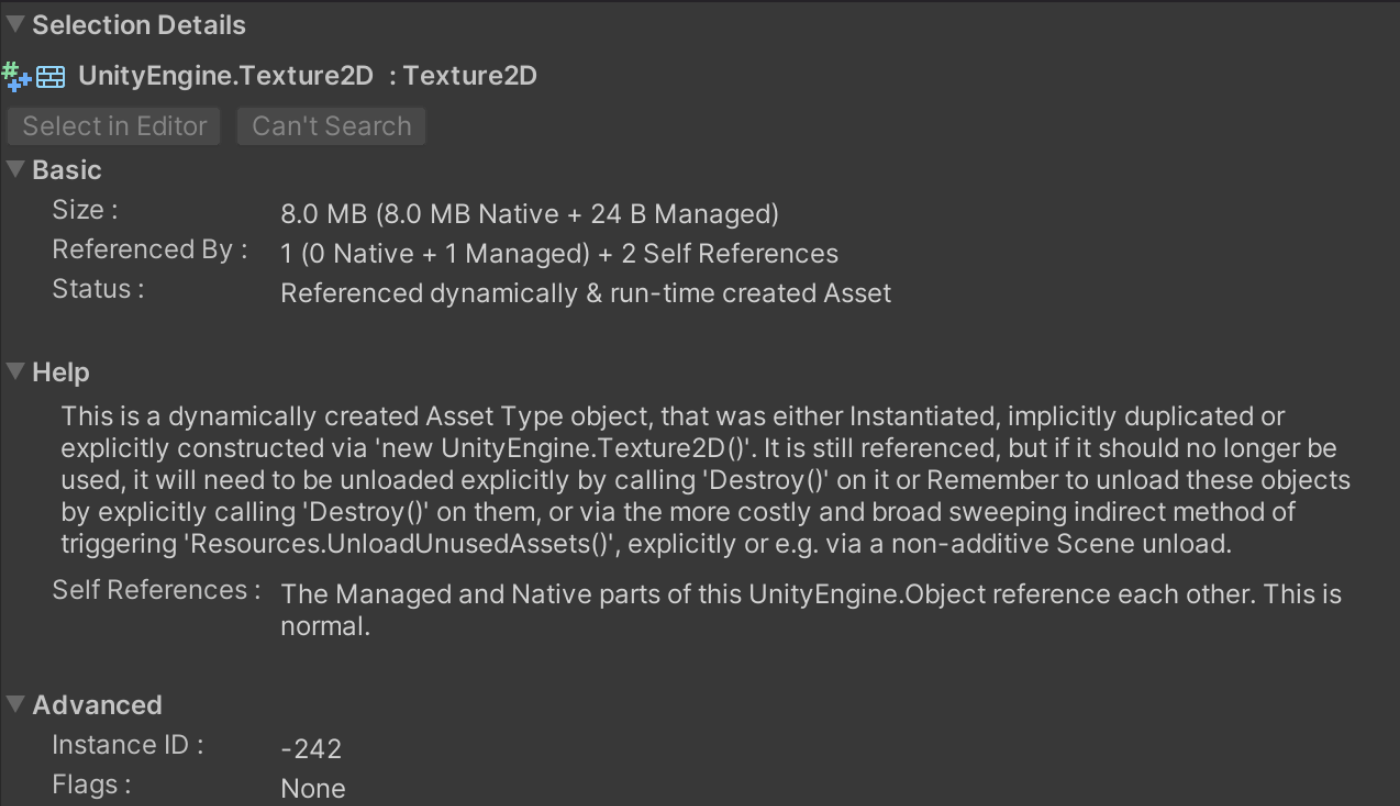
Figure 3.51: Selection Details
Supplemental: Measurement results other than Summary
"Objects and Allocations" differs from Summary in that more detailed information such as allocations can be viewed in table format.
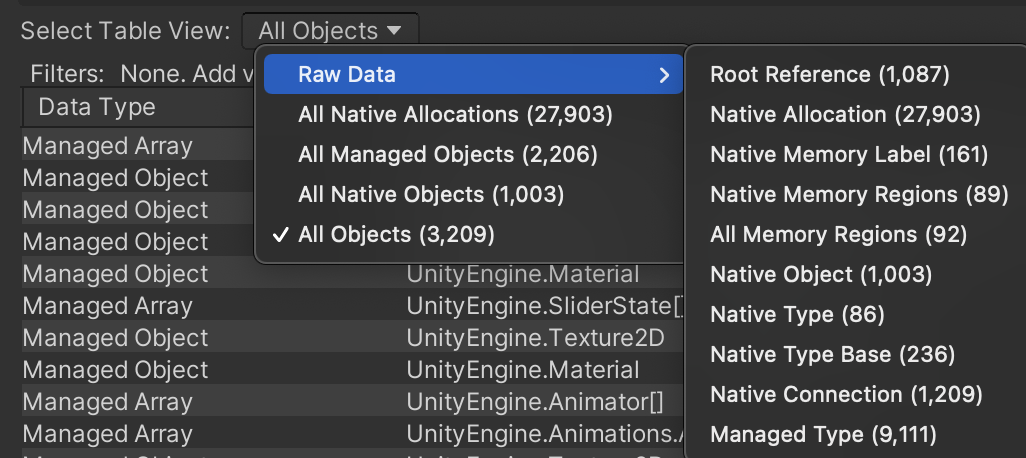
Figure 3.52: Table View Specifications
Fragmentation" visualizes the virtual memory status and can be used to investigate fragmentation.However, it may be difficult to use because it contains a lot of non-intuitive information such as memory addresses.
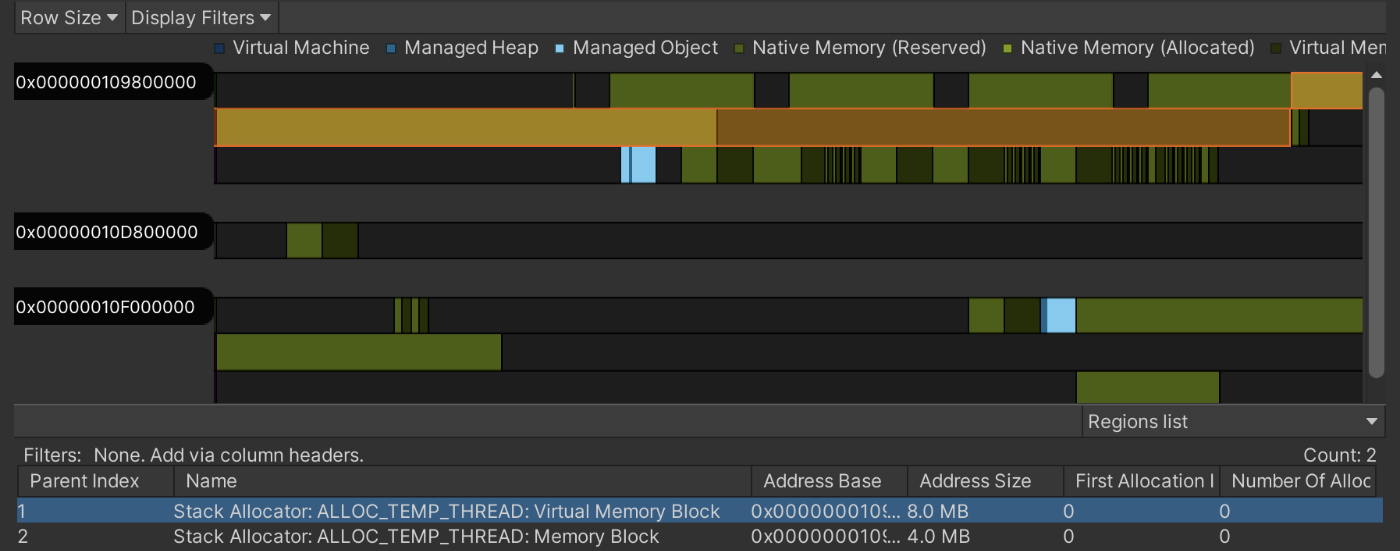
Figure 3.53: Fragmentation
A new feature called "Memory Breakdowns" has been added since v0.6 of Memory Profiler.Unity 2022.1 or later is required, but it is now possible to view TreeMaps in list view and object information such as Unity Subsystems.Other new features include the ability to check for possible duplicate objects.
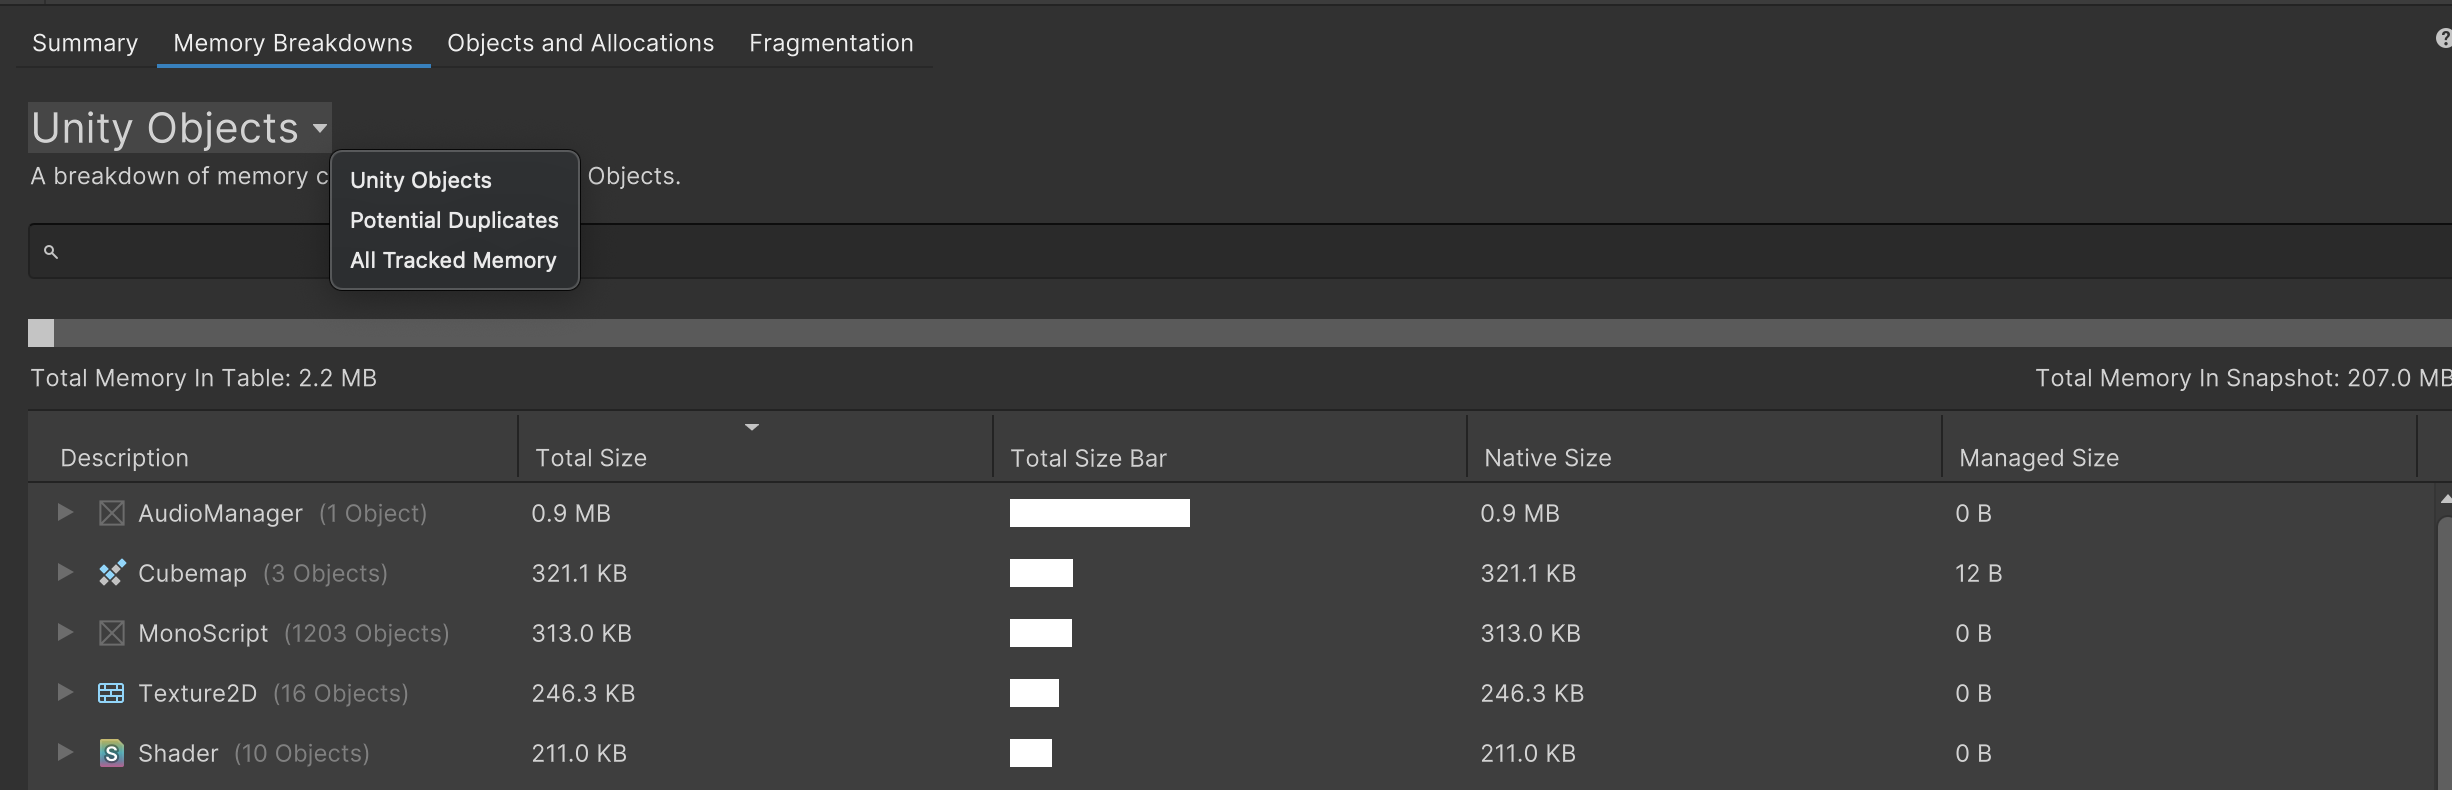
Figure 3.54: Memory Breakdowns
3.5. Heap Explorer
Heap Explorer is an open source tool from private developer Peter77 *1.Like Memory Profiler, this tool is often used to investigate memory.Memory Profiler was very labor intensive to track down references in versions prior to 0.4 because they were not displayed in a list format.Although this has been improved in 0.5 and later, there may be some who use a version of Unity that is not supported.It is still very valuable as an alternative tool in such cases, so we would like to cover it in this issue.
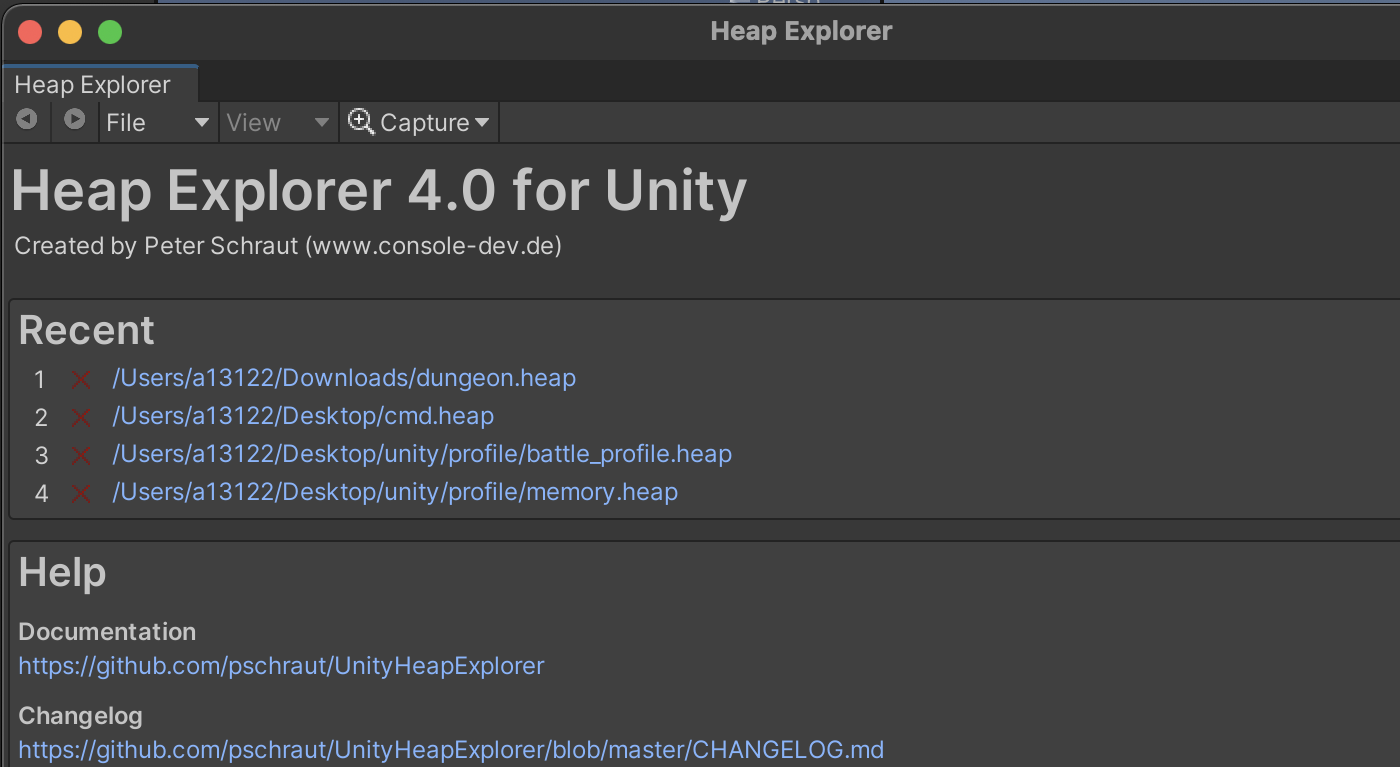
Figure 3.55: Heap Explorer
3.5.1. How to install
Copy thePackage URL's listed in the GitHub repository *2 and add it from the Add Package from Git url in the Package Manager.After installation, you can launch the tool from "Window -> Analysis -> Memory Profiler".
3.5.2. How to use
The toolbar of Heap Explorer looks like this

Figure 3.56: Heap Explorer toolbar
- Left and right arrows
- Allows you to go back and forward in an operation. This is especially useful for tracking references.
- File
- Allows saving and loading of measurement files. The file is saved with a .heap extension.
- View
- Switch between different display screens. There are various types, so if you are interested, please refer to the documentation.
- Capture
- Capture measurement. However, the measurement target cannot be changed in Heap Explorer.The target must be changed in the Unity Profiler or other tools provided by Unity.Save saves the measurement to a file and displays the results, while Analyze displays the results without saving.Note that, as with the Memory Profiler, memory allocated during measurement is not released.
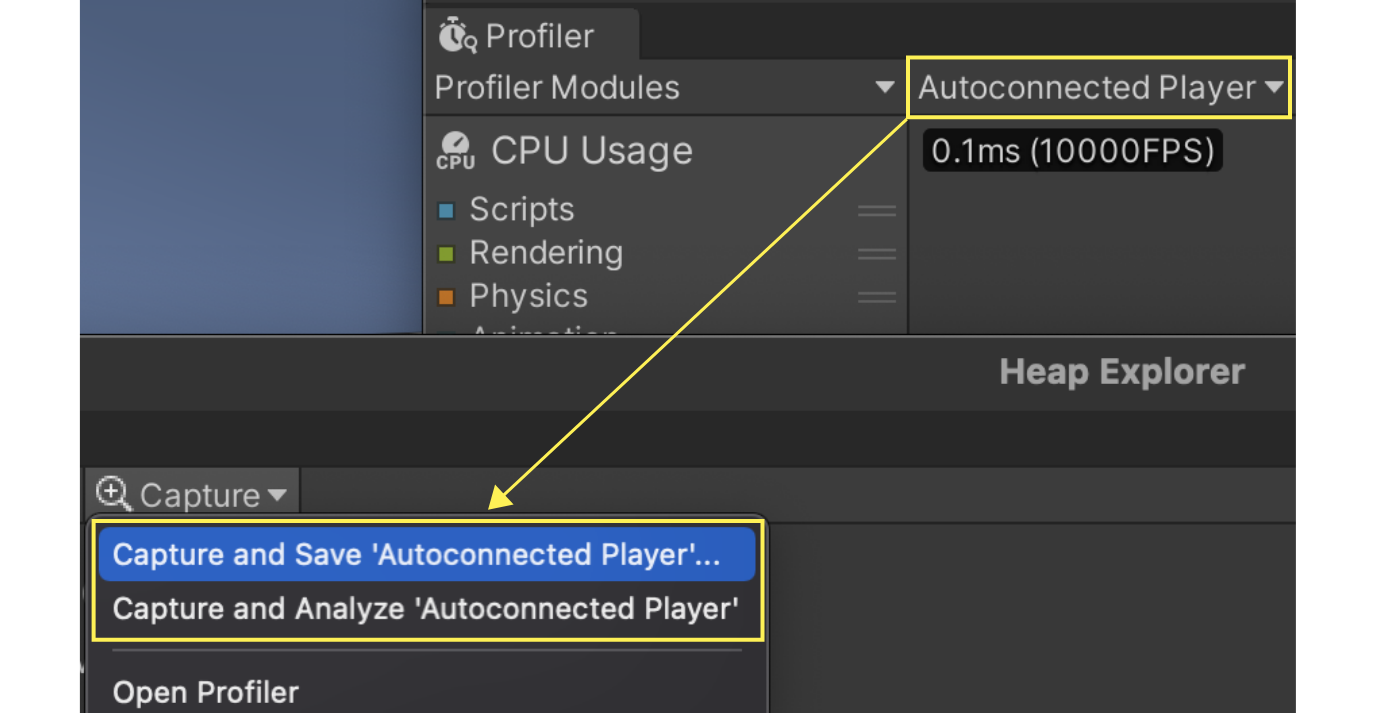
Figure 3.57: Switching measurement targets
The measurement result screen looks like the following. This screen is called Overview.
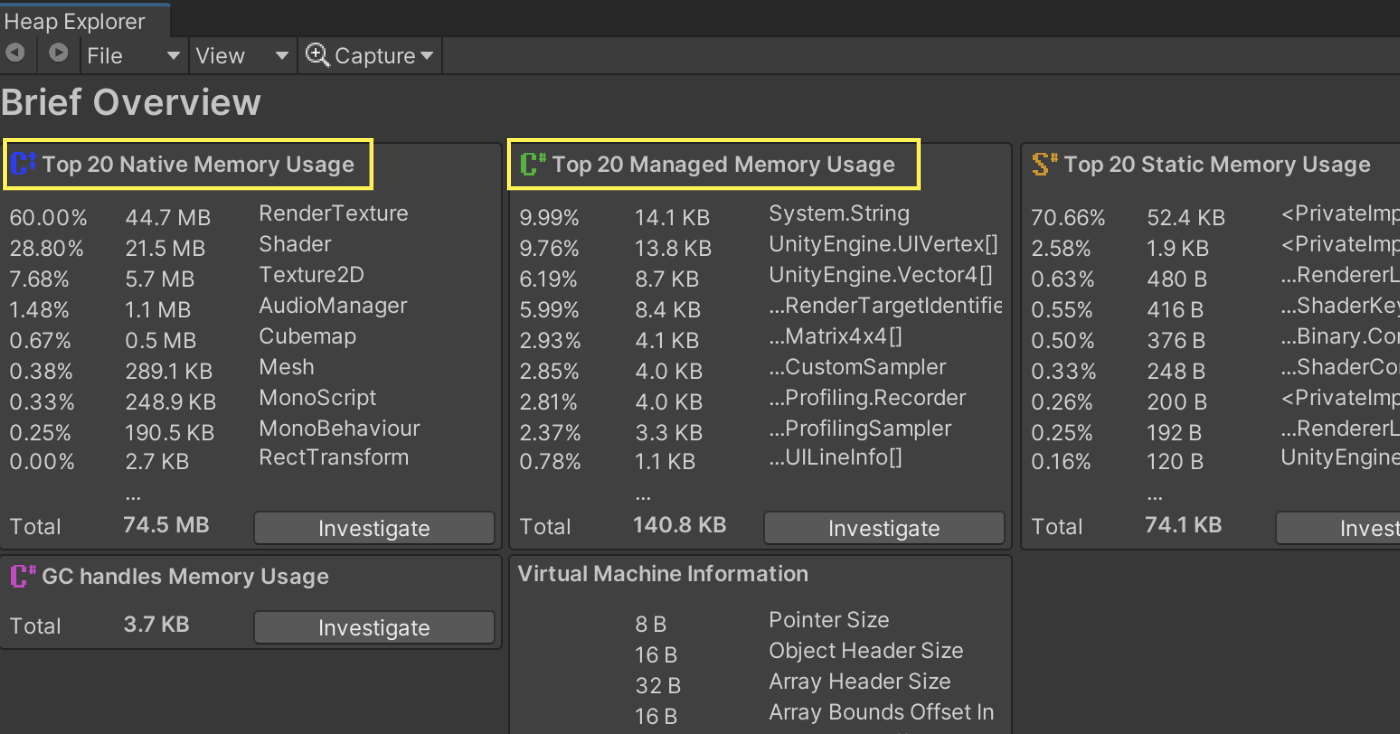
Figure 3.58: Heap Explorer measurement results (Overview)
In the Overview, the categories of particular concern are Native Memory Usage and Managed Memory Usage, which are indicated by green lines.Click the "Investigate" button to see the details of each category.
In the following sections, we will focus on the important parts of the category details.
1. object
When Native Memory is Investigate, C++ Objects are displayed in this area.In case of Managed Memory, C# Objects will be displayed in this area.
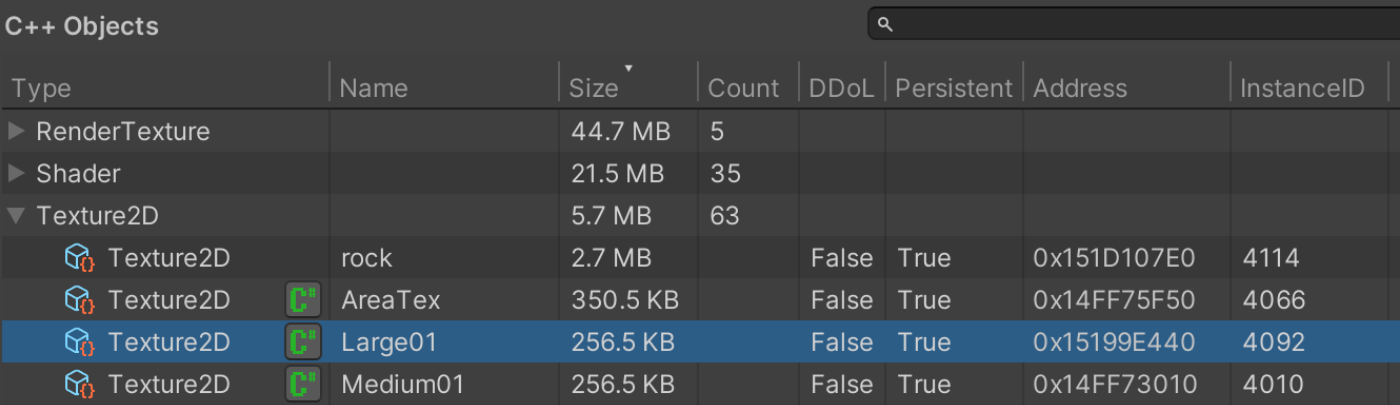
Figure 3.59: Object display area
There are some unfamiliar items in the header.
- DDoL
- DDoL stands for "Don't Destroy On Load. You can see if the object is designated as an object that will not be destroyed after a scene transition.
- Persistent
- Indicates whether the object is a persistent object or not. This is an object that is automatically created by Unity at startup.
The display area introduced below will be updated by selecting the object Figure 3.59.
Referenced by
The object from which the target object is referenced is displayed.
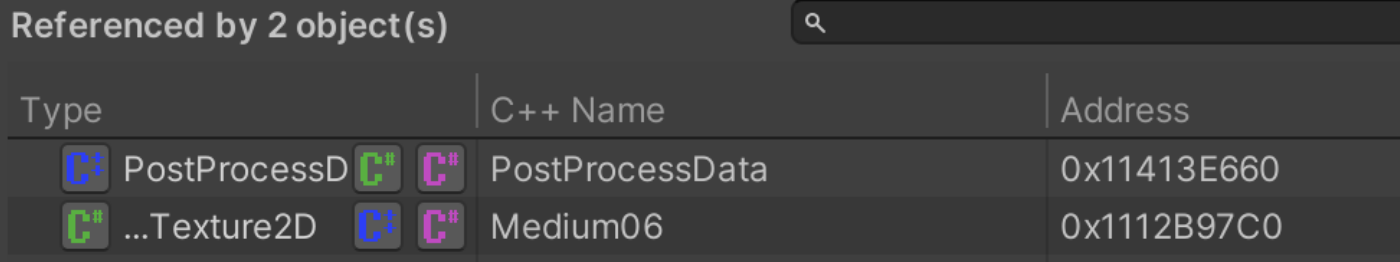
Figure 3.60: Referenced by
References to
Displays objects that are referenced by the target object.
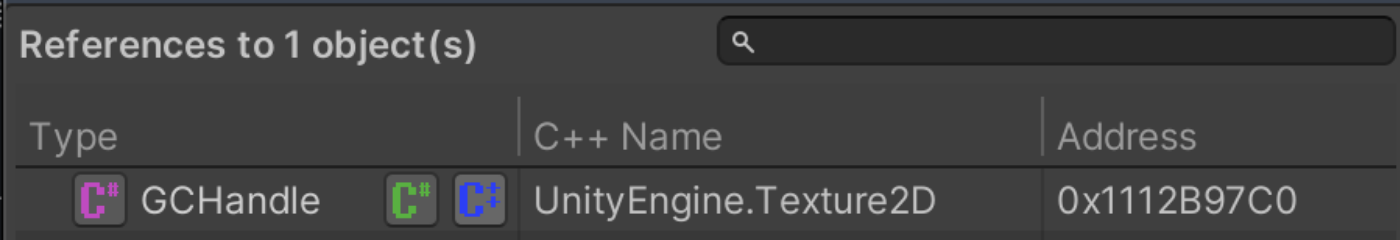
Figure 3.61: References to
Path to Root
Displays the root objects that reference the target object.This is useful when investigating memory leaks, as it allows you to see what is holding the reference.
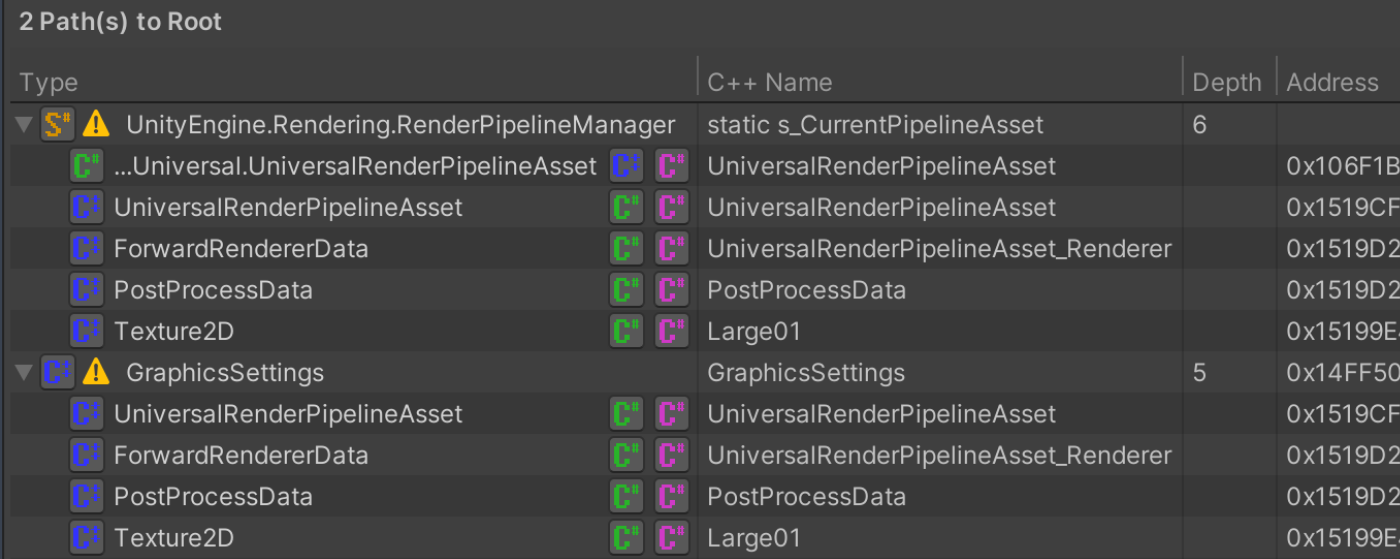
Figure 3.62: Path to Root
The following image summarizes the previous items.
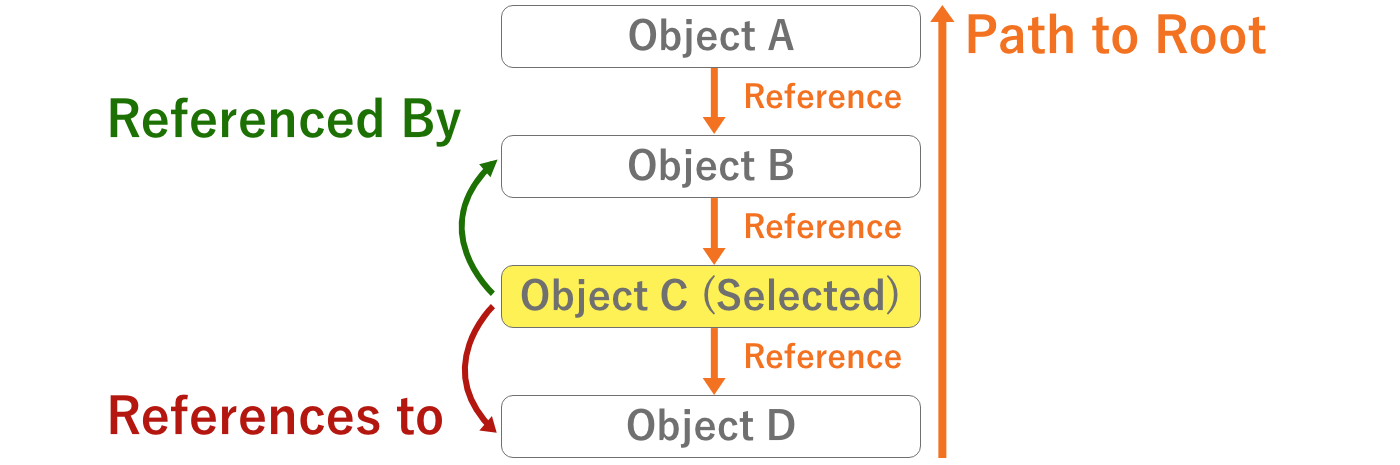
Figure 3.63: Reference Image
As introduced so far, Heap Explorer provides a complete set of functions necessary for investigating memory leaks and memory.It is also very lightweight, so please consider using this tool.If you like it, it would be better if you add a Star as a token of your appreciation.
3.6. Xcode
Xcode is an integrated development environment tool provided by Apple.When you set the target platform as iOS in Unity, the build result will be an Xcode project.It is recommended to use Xcode for rigorous verification, as it provides more accurate values than Unity.In this section, we will touch on three profiling tools: Debug Navigator, GPU Frame Capture, and Memory Graph.
3.6.1. Profiling Methods
There are two ways to profile from Xcode.The first is to build and run the application directly from Xcode.Figure 3.64 The first method is to build the application directly from Xcode and run it on the terminal.Settings such as certificates when performing a build are omitted from this document.
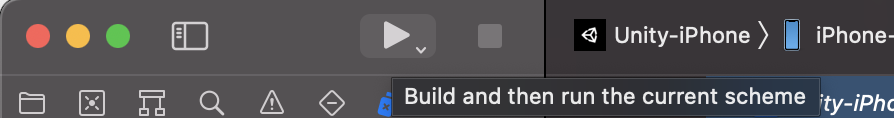
Figure 3.64: Xcode's Execute button
The second method is to attach the running application to the Xcode debugger.This can be profiled by selecting the running process from "Debug -> Attach to Process" in the Xcode menu after running the application.However, the certificate at build time must be for developer (Apple Development).Note that Ad Hoc or Enterprise certificates cannot be used to attach.
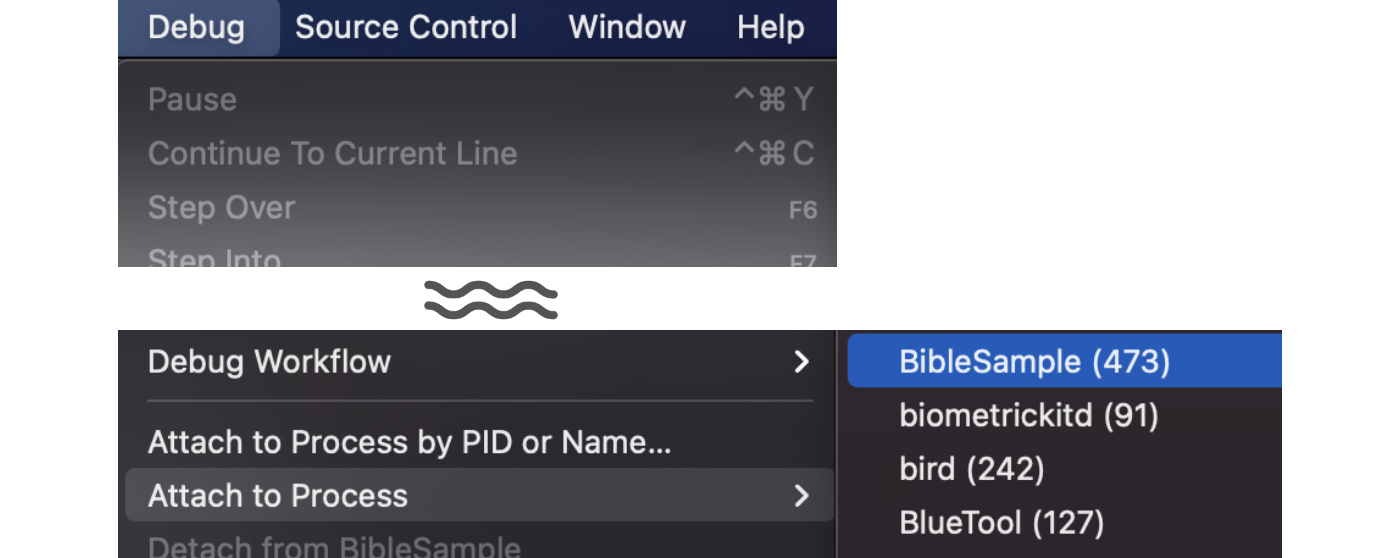
Figure 3.65: Debugger Attach in Xcode
3.6.2. Debug Navigator
Debug Navigator allows you to check debugging gauges such as CPU and Memory just by running the application from Xcode.Six items are displayed by pressing the spray mark of Figure 3.66 after running the application.Alternatively, you can open it from "View -> Navigators -> Debug" in the Xcode menu.Each item will be explained in the following sections.
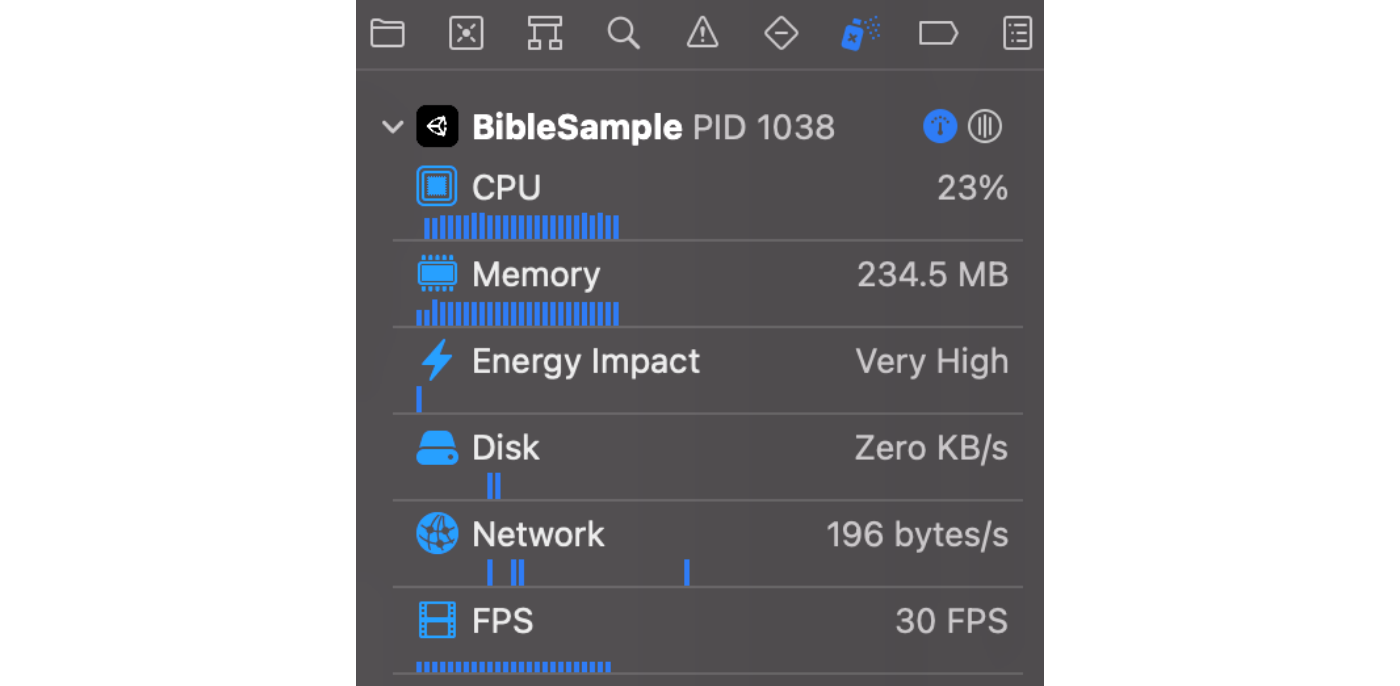
Figure 3.66: Selecting Debug Navigator
1. CPU Gauge
You can see how much CPU is being used.You can also see the usage rate of each thread.
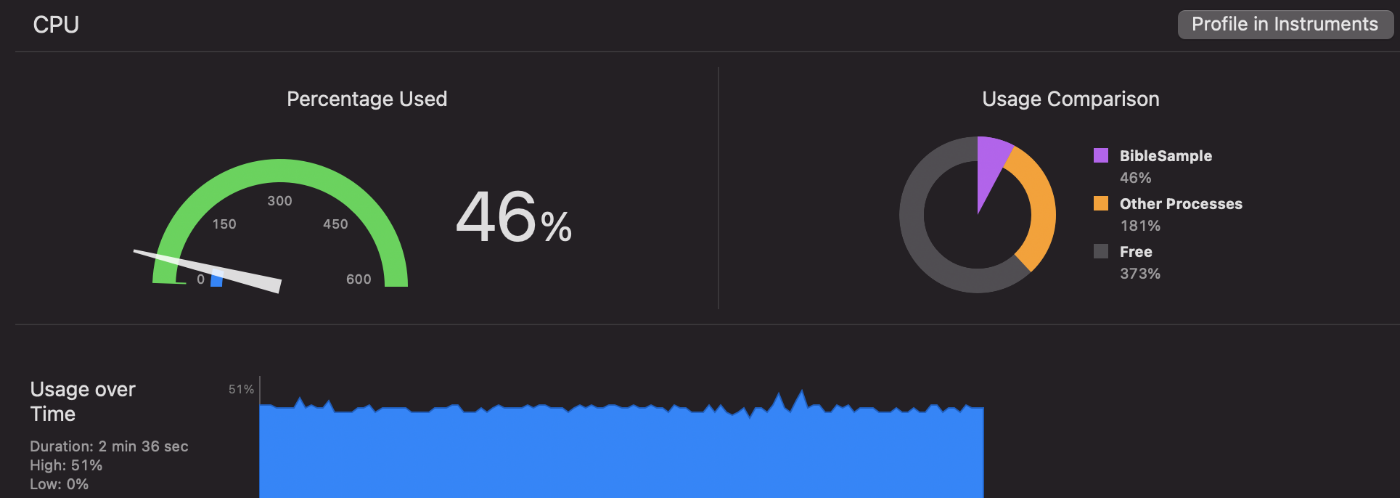
Figure 3.67: CPU Gauge
2. Memory Gauge
An overview of memory consumption can be viewed.Detailed analysis such as breakdown is not available.
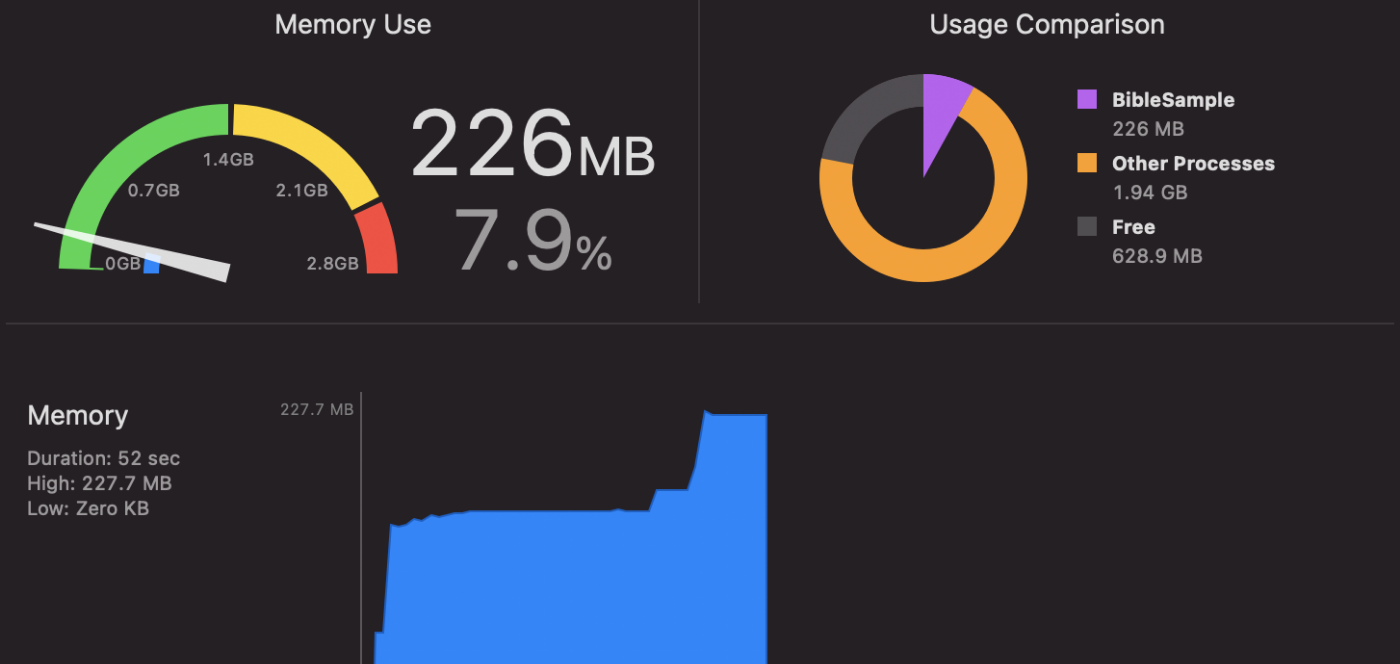
Figure 3.68: Memory Gauge
Energy Gauge
This gauge provides an overview of power consumption.You can get a breakdown of CPU, GPU, Network, etc. usage.
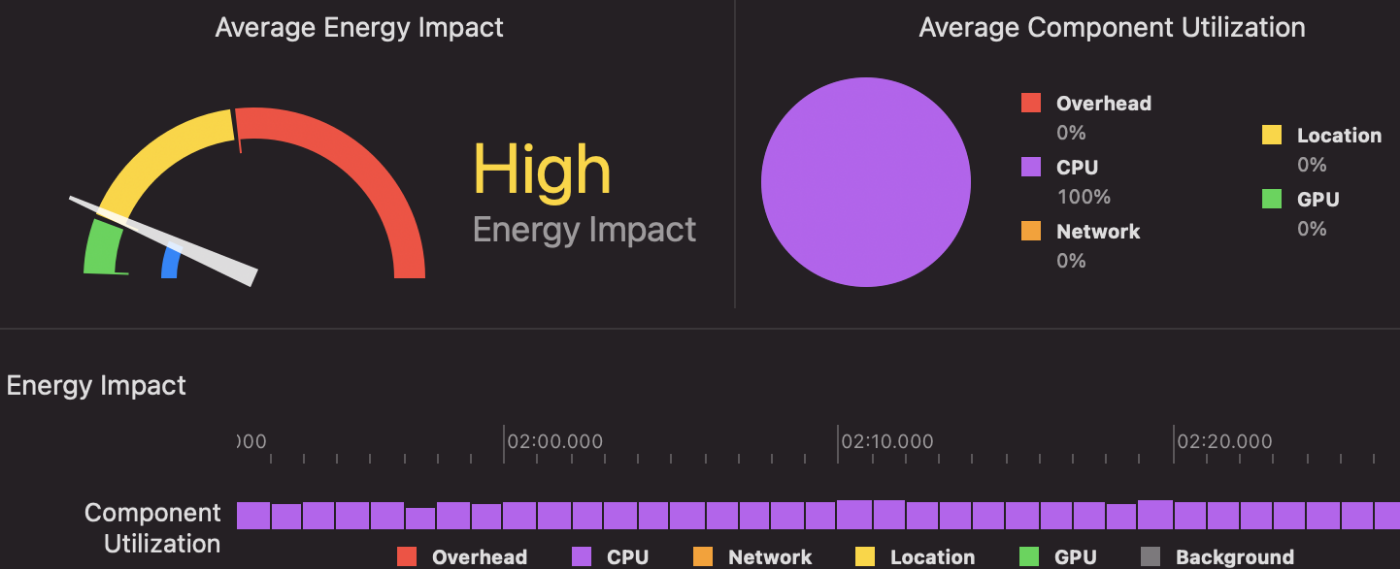
Figure 3.69: Energy Gauge
Disk Gauge
This gauge provides an overview of File I/O.It will be useful to check if files are being read or written at unexpected times.
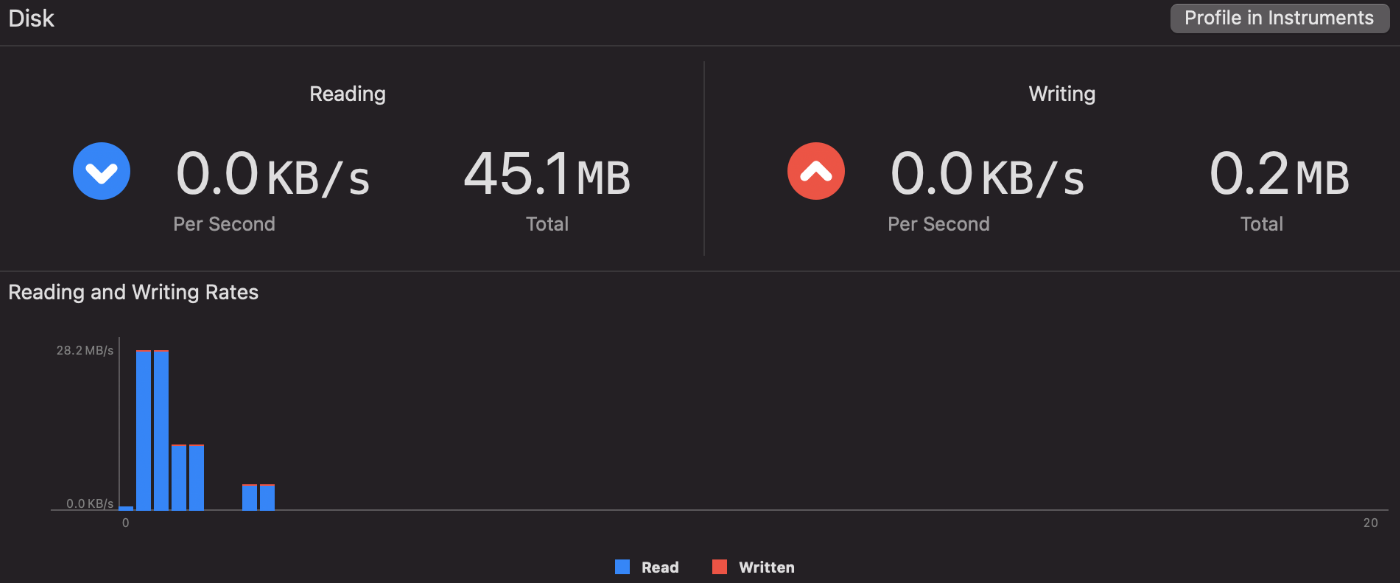
Figure 3.70: Disk Gauge
5. Network Gauge
This gauge provides an overview of network communication.Like the Disk gauge, it is useful for checking for unexpected communication.
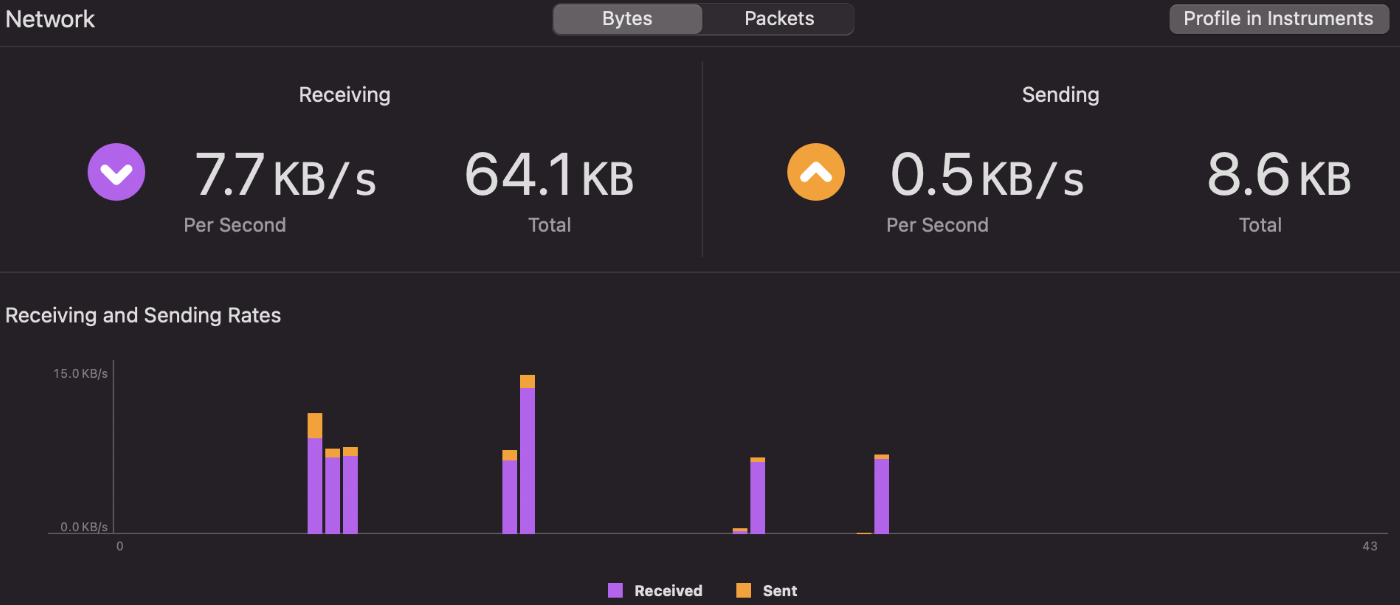
Figure 3.71: Network Gauge
FPS Gauge
This gauge is not displayed by default.It is displayed when GPU Frame Capture, described at "3.6.3 GPU Frame Capture", is enabled.You can check not only the FPS, but also the utilization of shader stages and the processing time of each CPU and GPU.
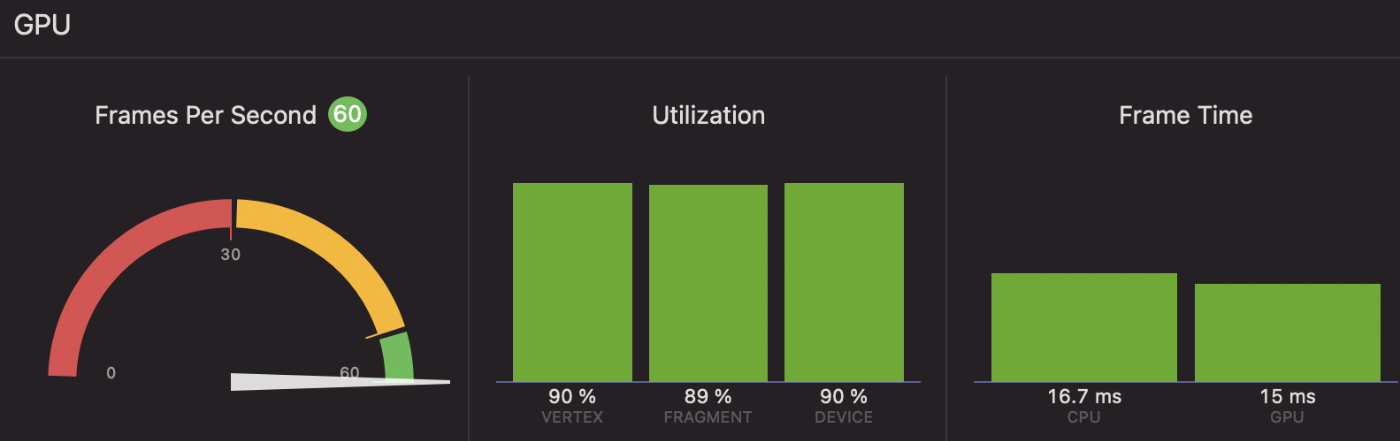
Figure 3.72: FPS Gauge
3.6.3. GPU Frame Capture
GPU Frame Capture is a tool that allows frame debugging on Xcode.Similar to Unity's Frame Debugger, you can check the process until rendering is completed.Compared to Unity, there is more information at each shader stage, so it may be useful for analyzing and improving bottlenecks.The following is an explanation of how to use it.
1. preparation
To enable GPU Frame Capture in Xcode, you need to edit the scheme.First, open the scheme edit screen by selecting "Product -> Scheme -> Edit Scheme.
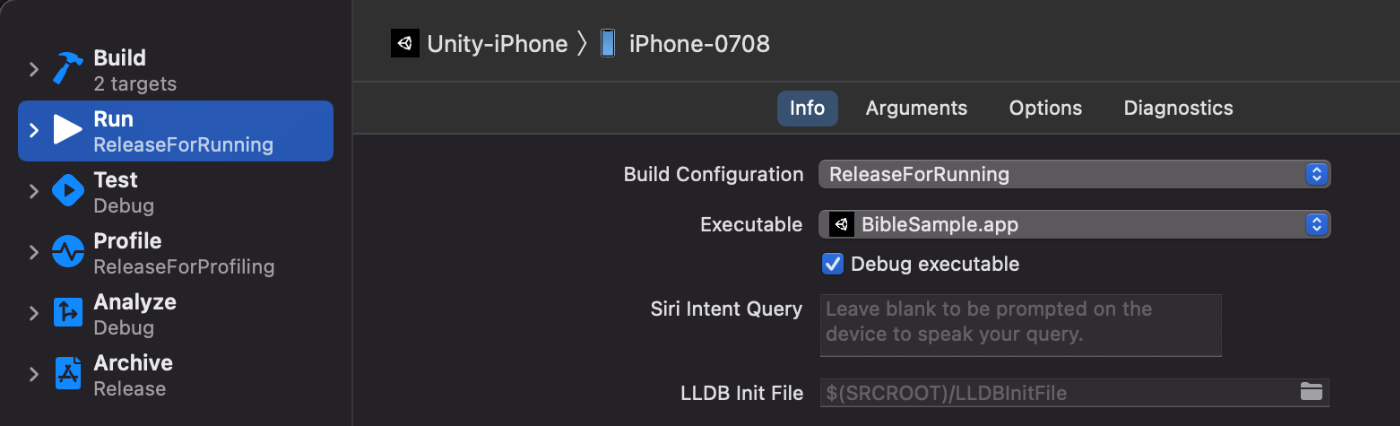
Figure 3.73: Edit Scheme screen
Next, change GPU Frame Capture to "Metal" from the "Options" tab.
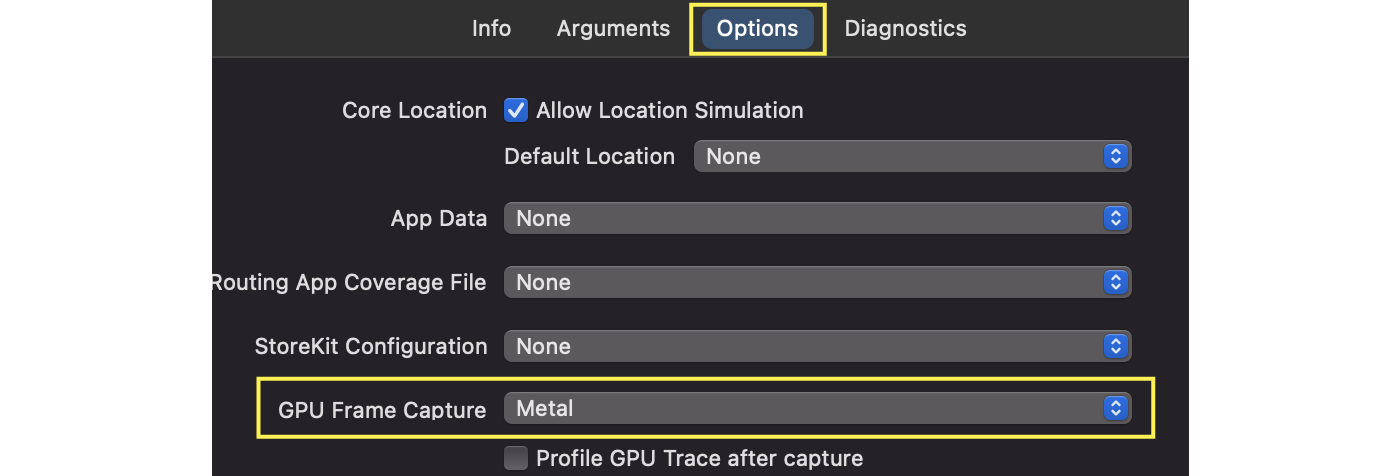
Figure 3.74: Enable GPU Frame Capture
Finally, from the "Diagnostics" tab, enable "Api Validation" for Metal.

Figure 3.75: Enable Api Validation
2. capture
Capture is performed by pressing the camera symbol from the debug bar during execution.Depending on the complexity of the scene, the first capture may take some time, so please be patient.Note that in Xcode13 or later, the icon has been changed to the Metal icon.
Figure 3.76: GPU Frame Capture button
When the capture is completed, the following summary screen will be displayed.
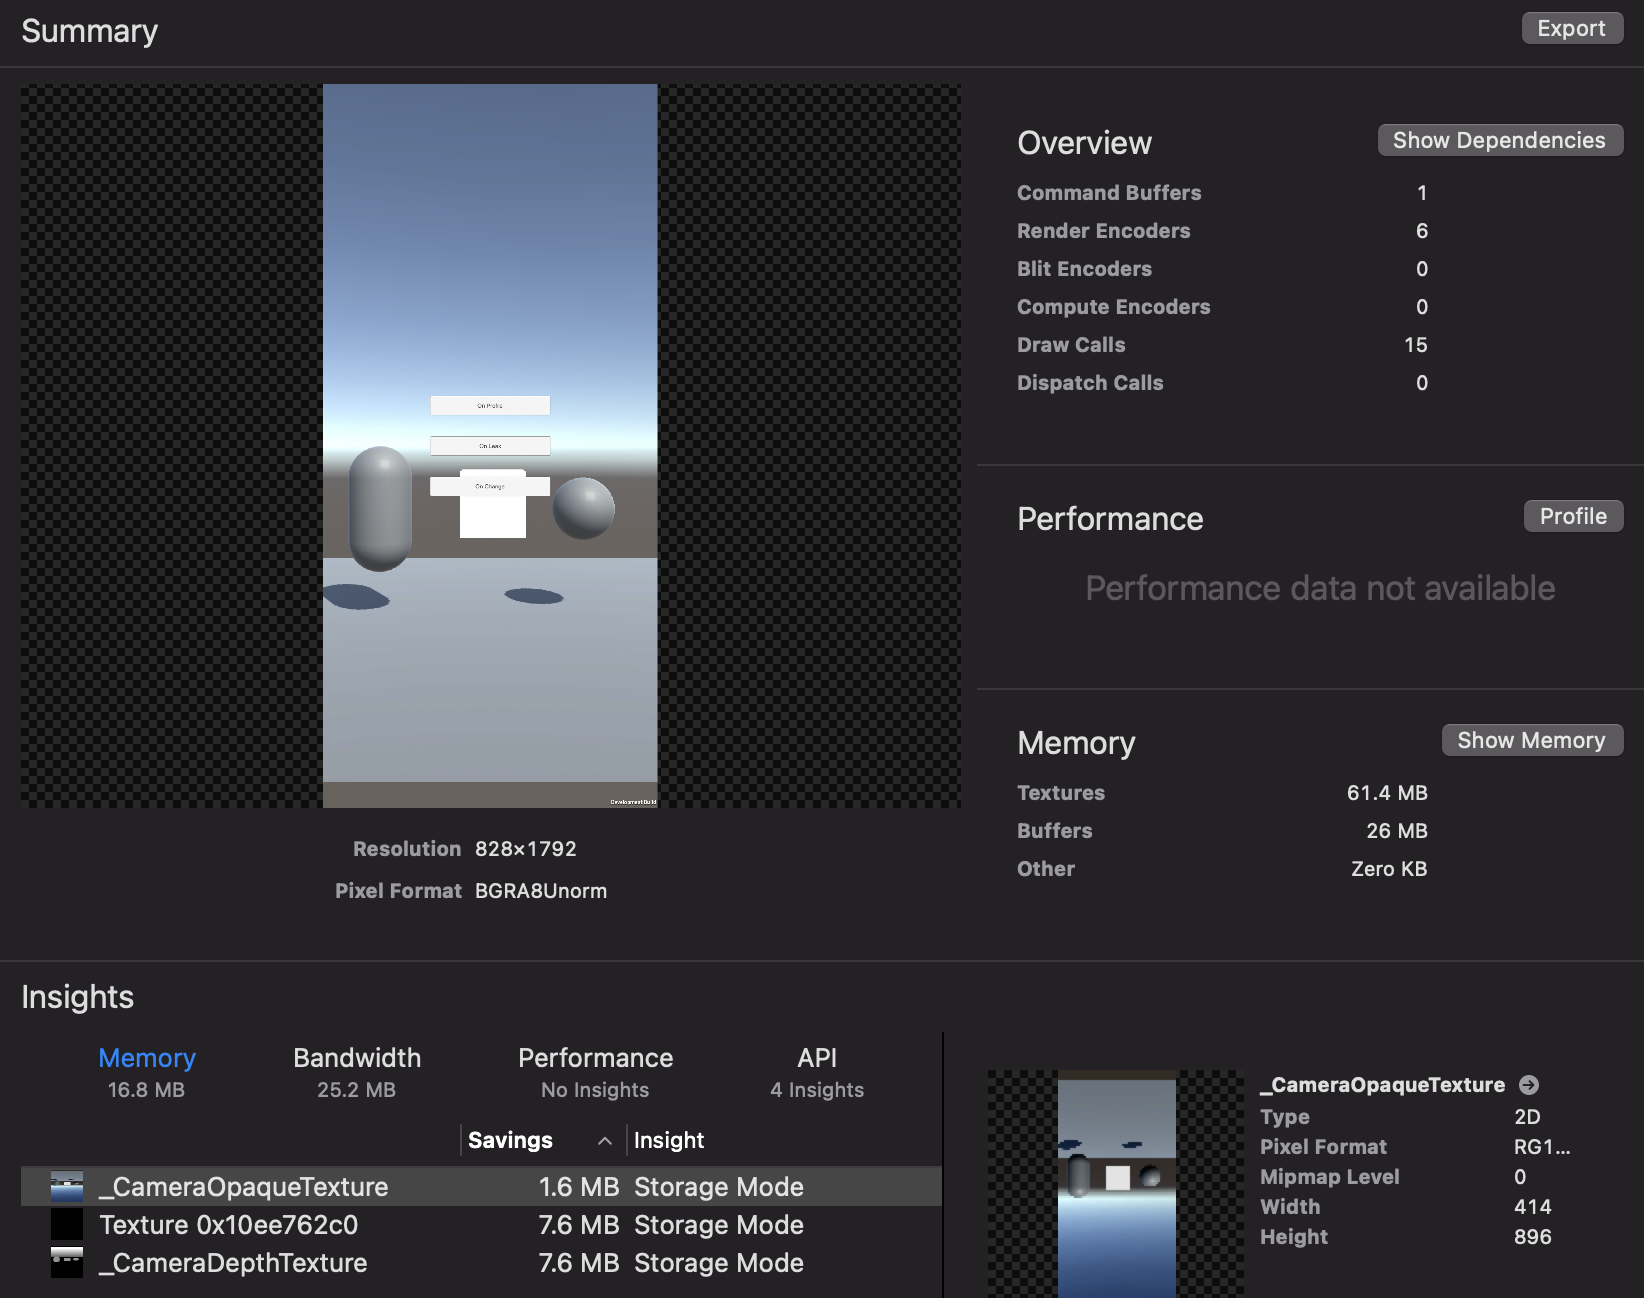
Figure 3.77: Summary screen
From this summary screen, you can move to a screen where you can check details such as drawing dependencies and memory.The Navigator area displays commands related to drawing.There are "View Frame By Call" and "View Frame By Pipeline State".
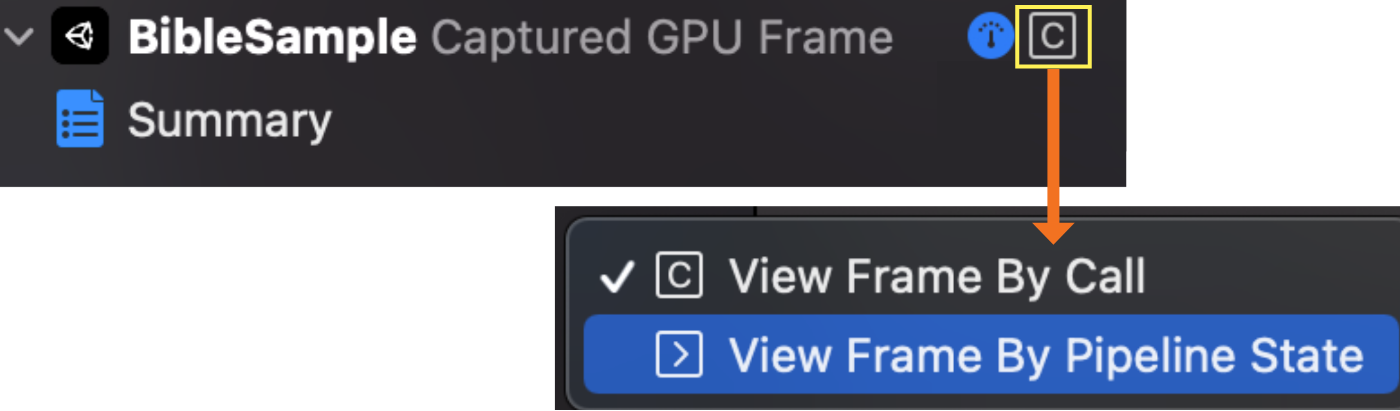
Figure 3.78: Changing the Display Method
In the By Call view, all drawing commands are listed in the order in which they were invoked.In the By Call view, all drawing commands are listed in the order in which they were invoked, which includes buffer settings and other preparations for drawing, so that a large number of commands are lined up.On the other hand, By Pipeline State lists only the drawing commands related to the geometry drawn by each shader.It is recommended to switch the display according to what you want to investigate.
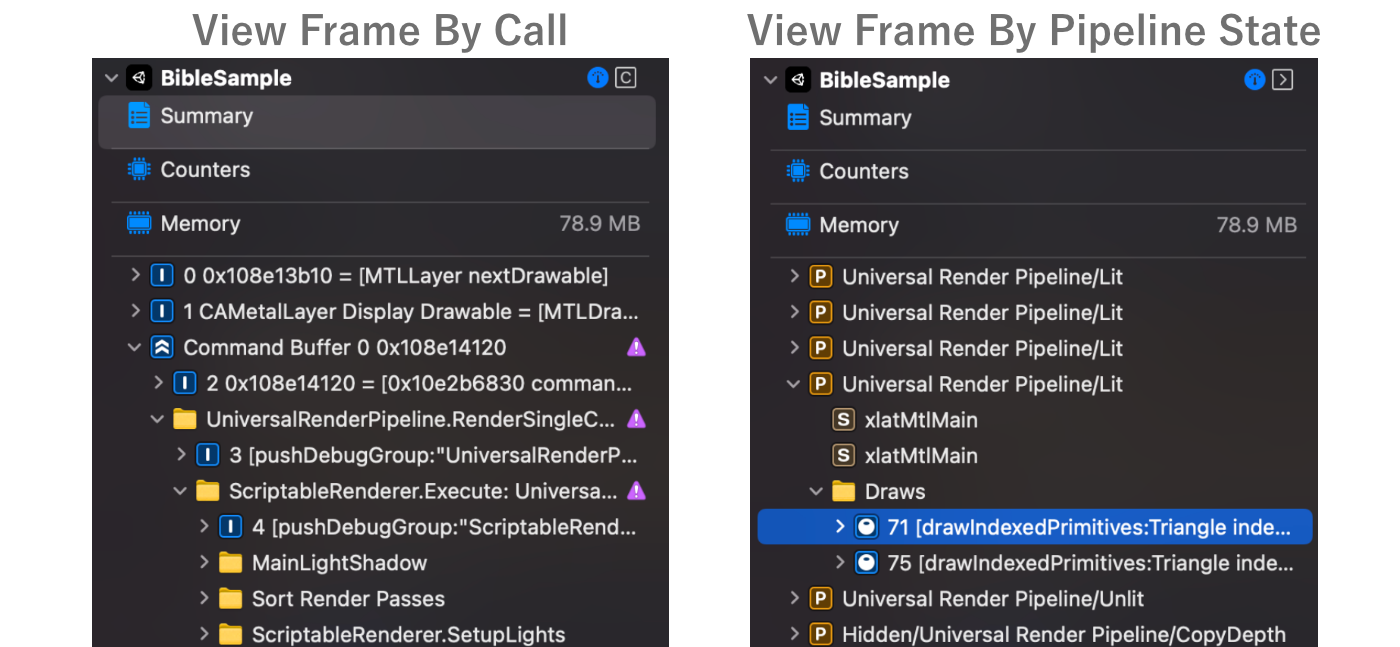
Figure 3.79: Differences in Display
By pressing any of the drawing commands in the Navigator area, you can check the properties used for that command.The properties include texture, buffer, sampler, shader functions, and geometry.Each property can be double-clicked to see the details.For example, you can see the shader code itself, whether the sampler is Repeat or Clamp, and so on.
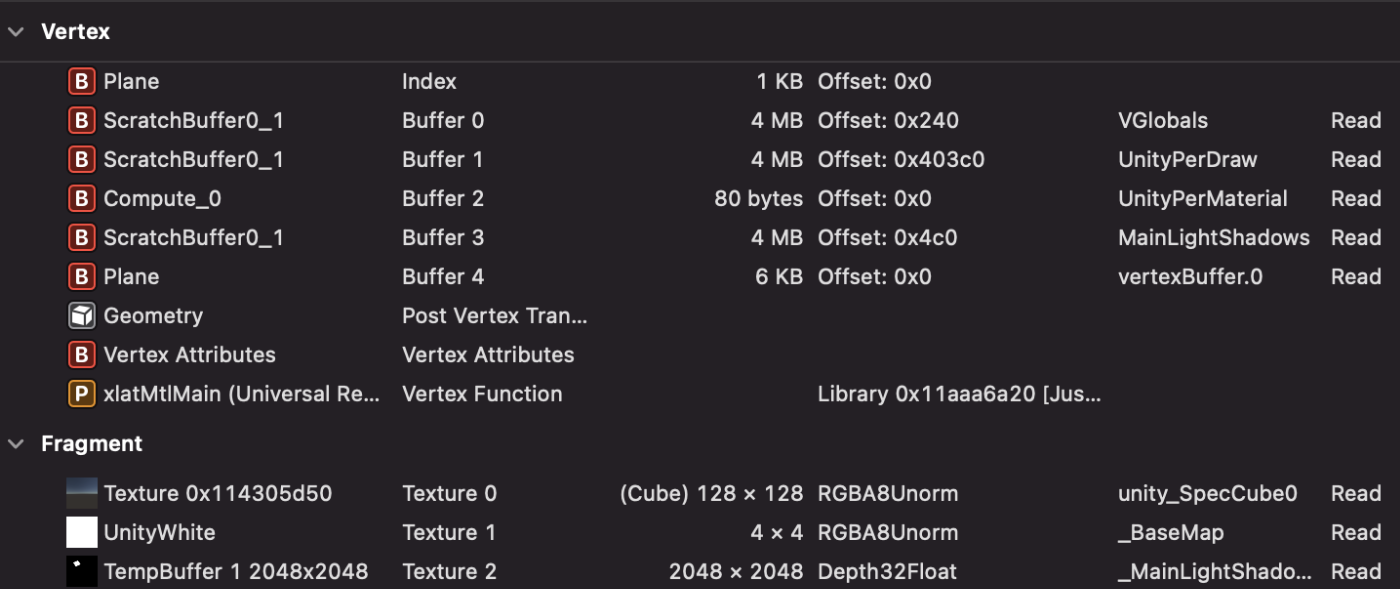
Figure 3.80: Drawing Command Details
Geometry properties not only display vertex information in a table format, but also allow you to move the camera to see the shape of the geometry.
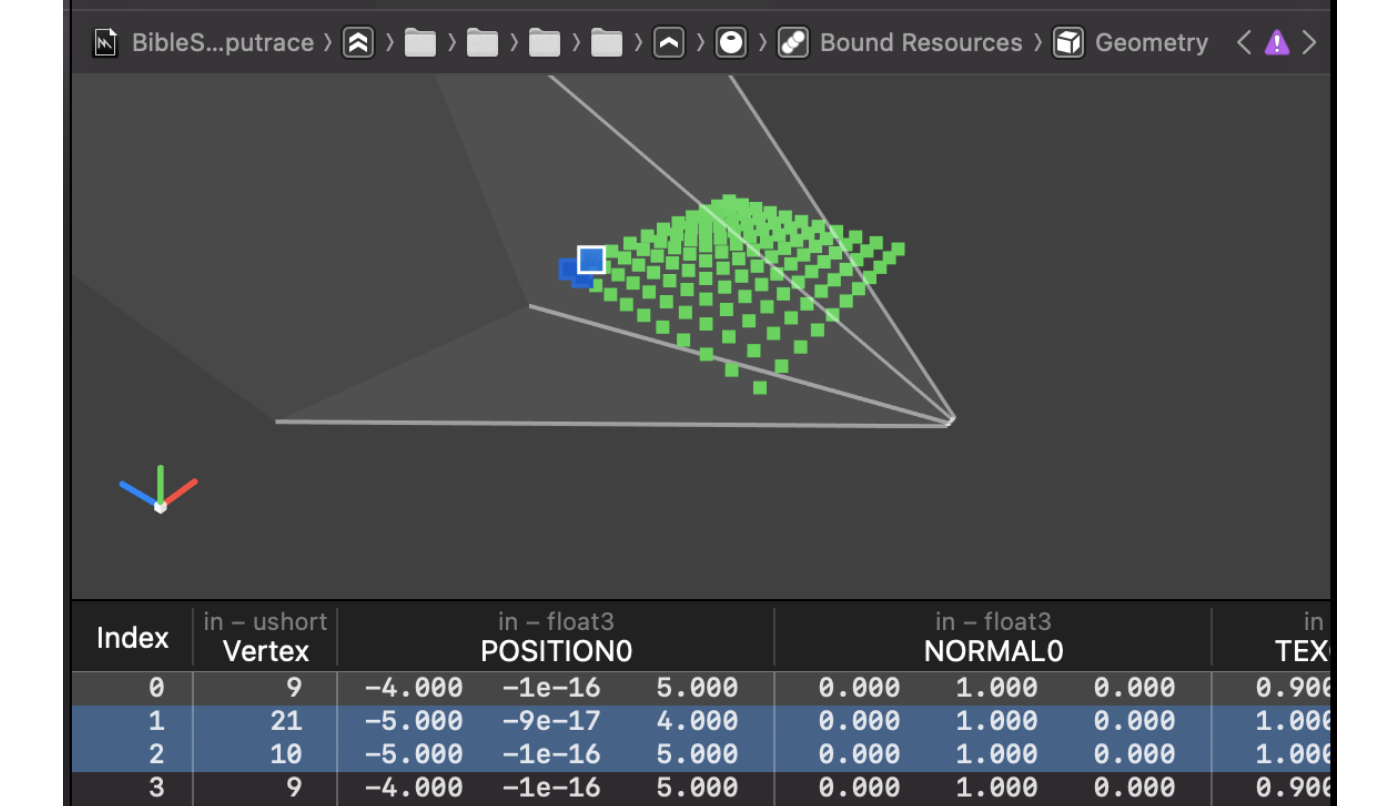
Figure 3.81: Geometry Viewer
Next, we will discuss "Profile" in the Performance column of the Summary screen.Clicking this button starts a more detailed analysis.When the analysis is finished, the time taken for drawing will be displayed in the Navigator area.
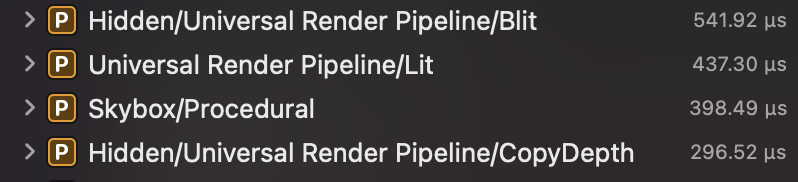
Figure 3.82: Display after Profile
The results of the analysis can be viewed in more detail in the "Counters" screen.In this screen, you can graphically see the processing time for each drawing such as Vertex, Rasterized, Fragment, etc.
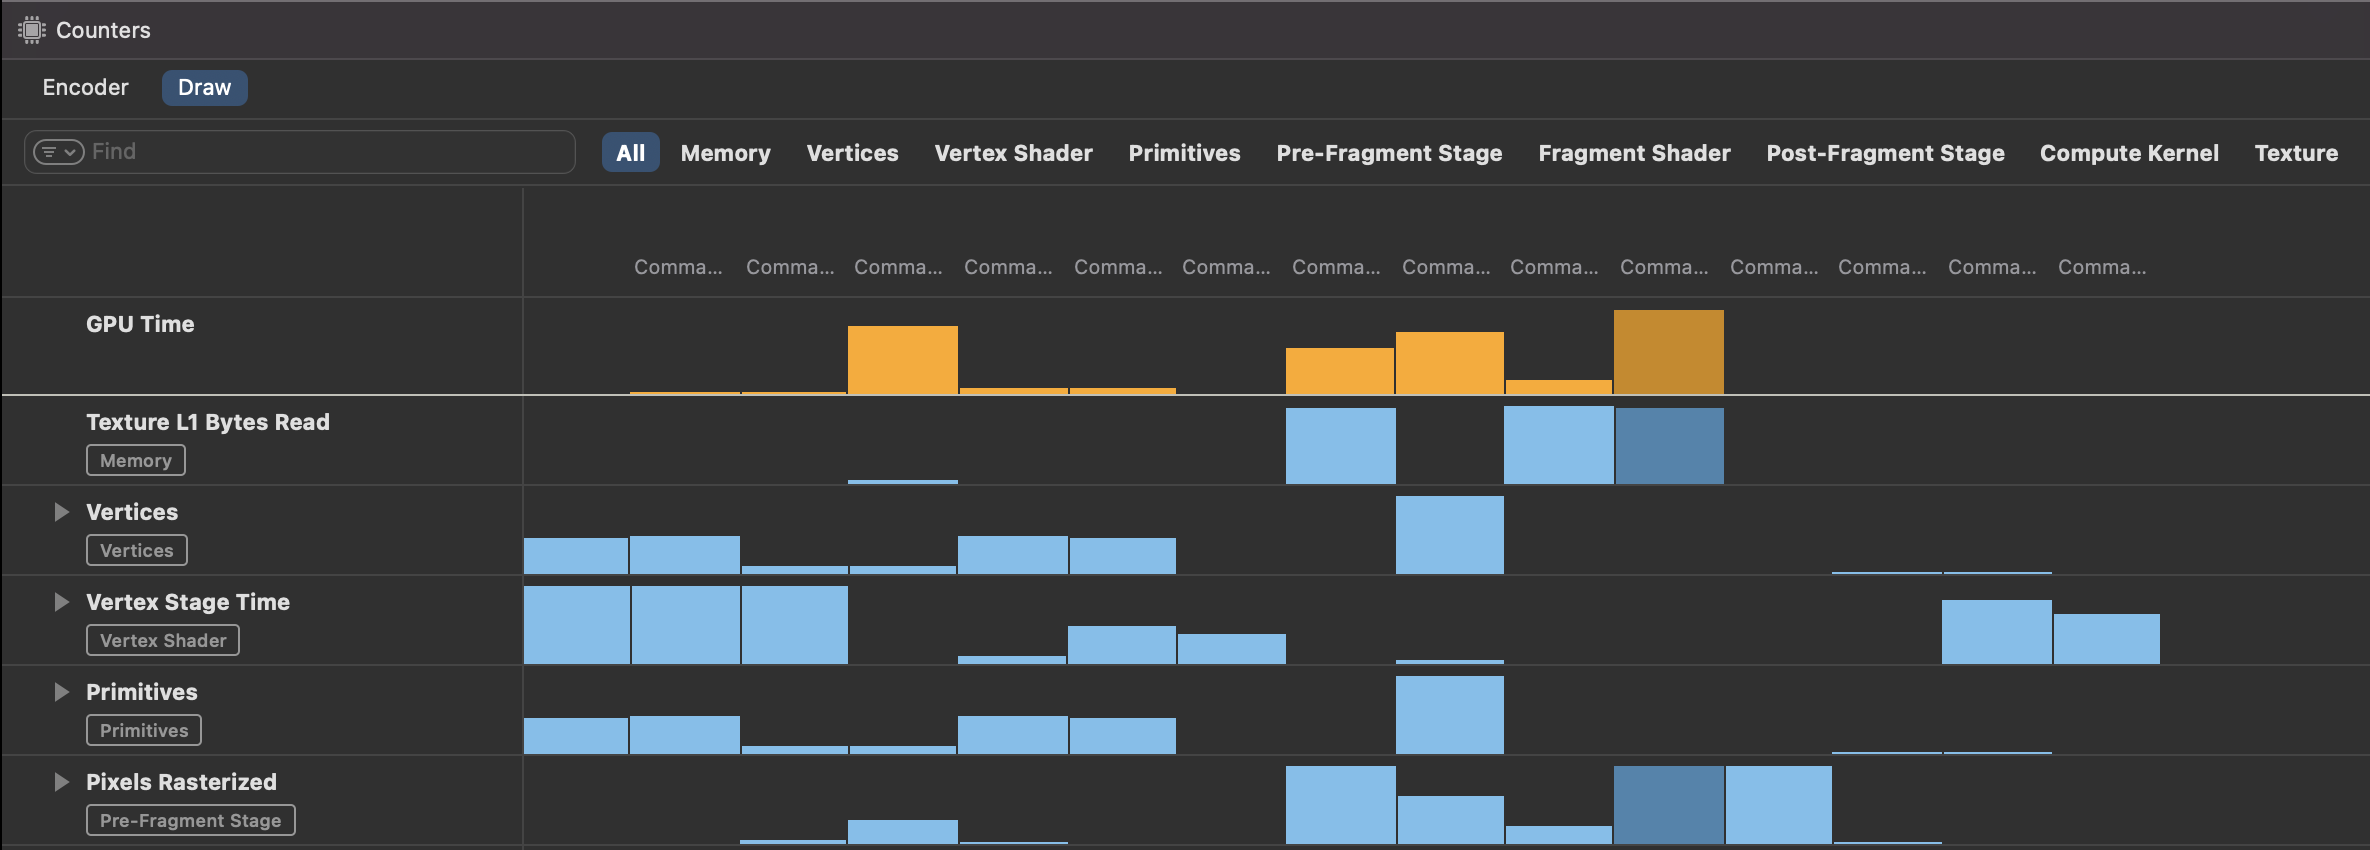
Figure 3.83: Counters screen
Next, "Show Memory" in the Memory column of the Summary screen is explained.Clicking this button will take you to a screen where you can check the resources used by the GPU.The information displayed is mainly textures and buffers. It is a good idea to check if there are any unnecessary items.
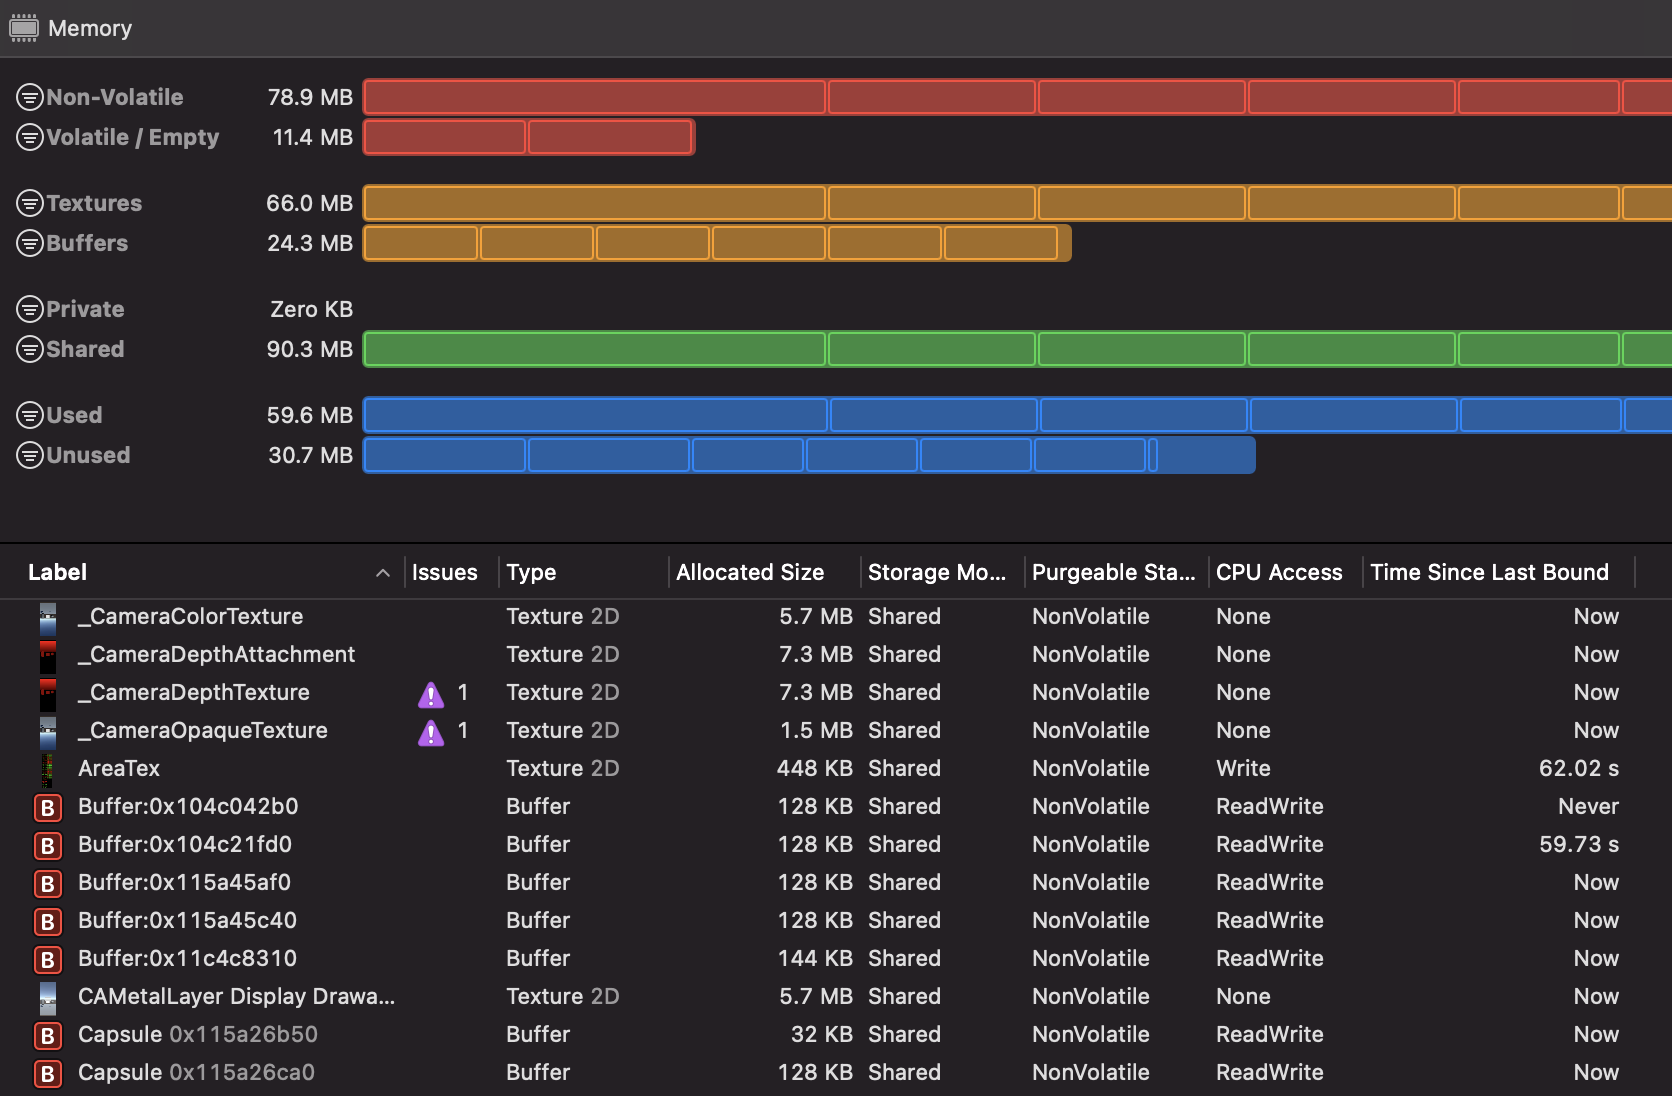
Figure 3.84: GPU Resource Confirmation Screen
Finally, "Show Dependencies" in the Overview section of the Summary screen is explained.Clicking this button displays the dependencies for each render pass.When viewing the dependencies, click the button with the arrow pointing outward to open more dependencies below that level.
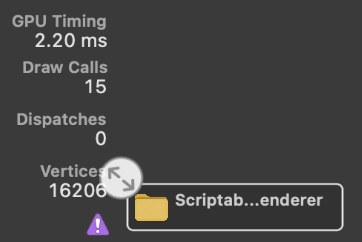
Figure 3.85: Open Dependency button
Use this screen when you want to see which drawings depend on what.
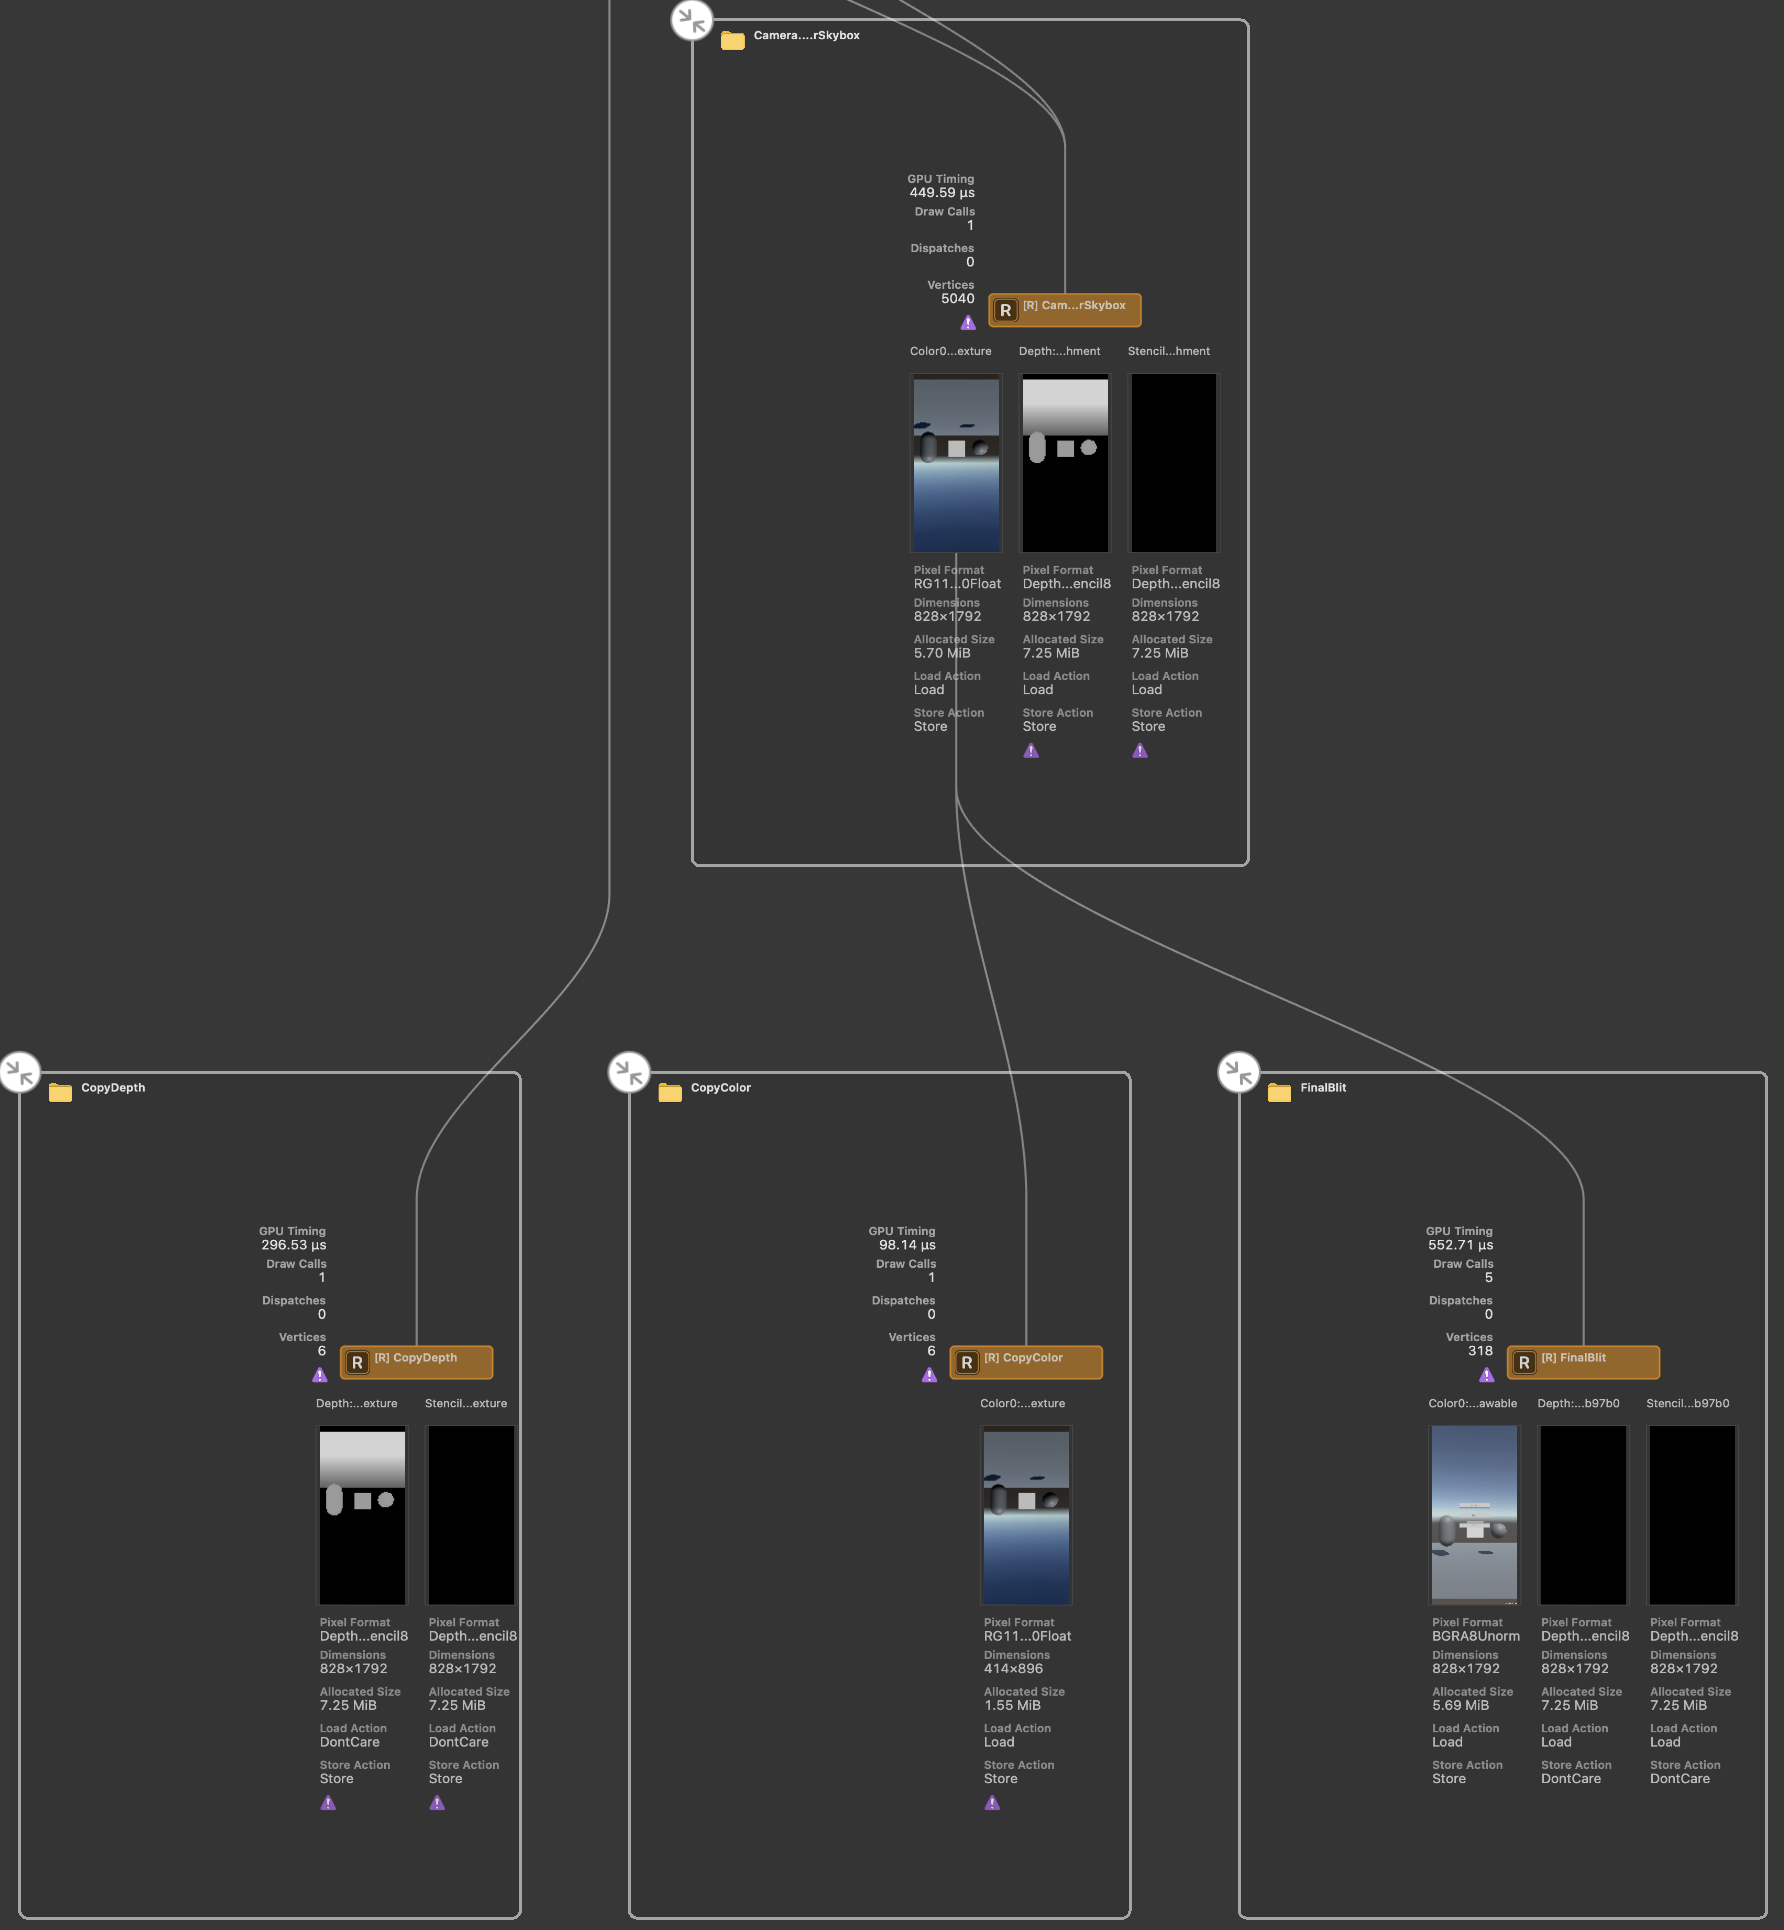
Figure 3.86: With the hierarchy open
3.6.4. Memory Graph
This tool allows you to analyze the memory situation at the time of capture.The Navigator area on the left displays instances, and by selecting an instance, the reference relationships are displayed in a graph.The Inspector area on the right displays detailed information about the instance.
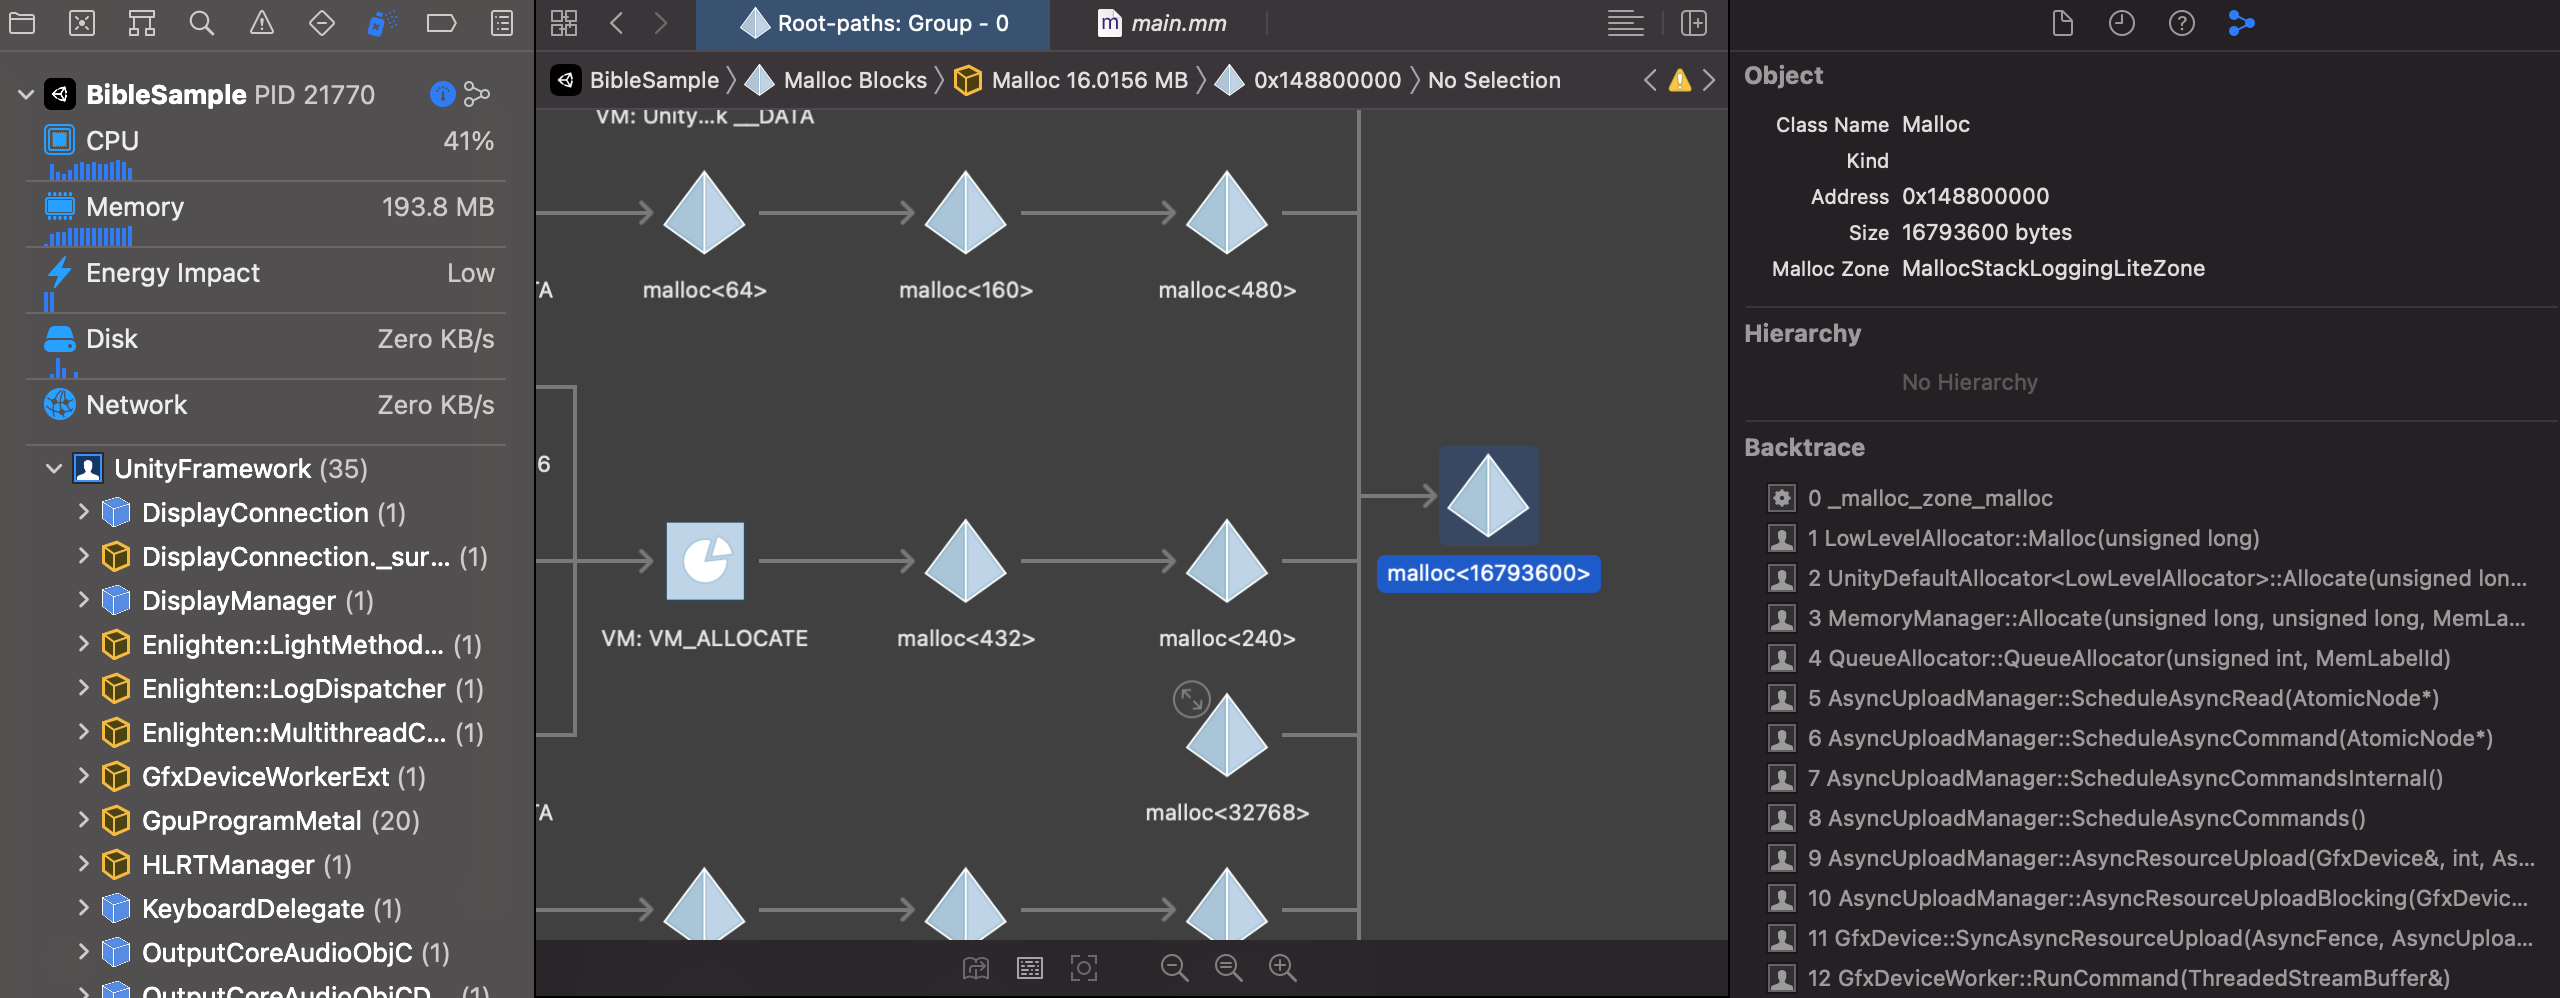
Figure 3.87: MemoryGraph Capture Screen
This tool can be used to investigate memory usage of objects that cannot be measured in Unity, such as plug-ins.The following is an explanation of how to use this tool.
1. preliminary preparation
In order to obtain useful information from Memory Graph, it is necessary to edit the scheme.Open the scheme edit screen by clicking "Product -> Scheme -> Edit Scheme.Then, enable "Malloc Stack Logging" from the "Diagnostics" tab.

Figure 3.88: Enable Malloc Stack Logging
By enabling this, Backtrace will be displayed in Inspector and you can see how it was allocated.
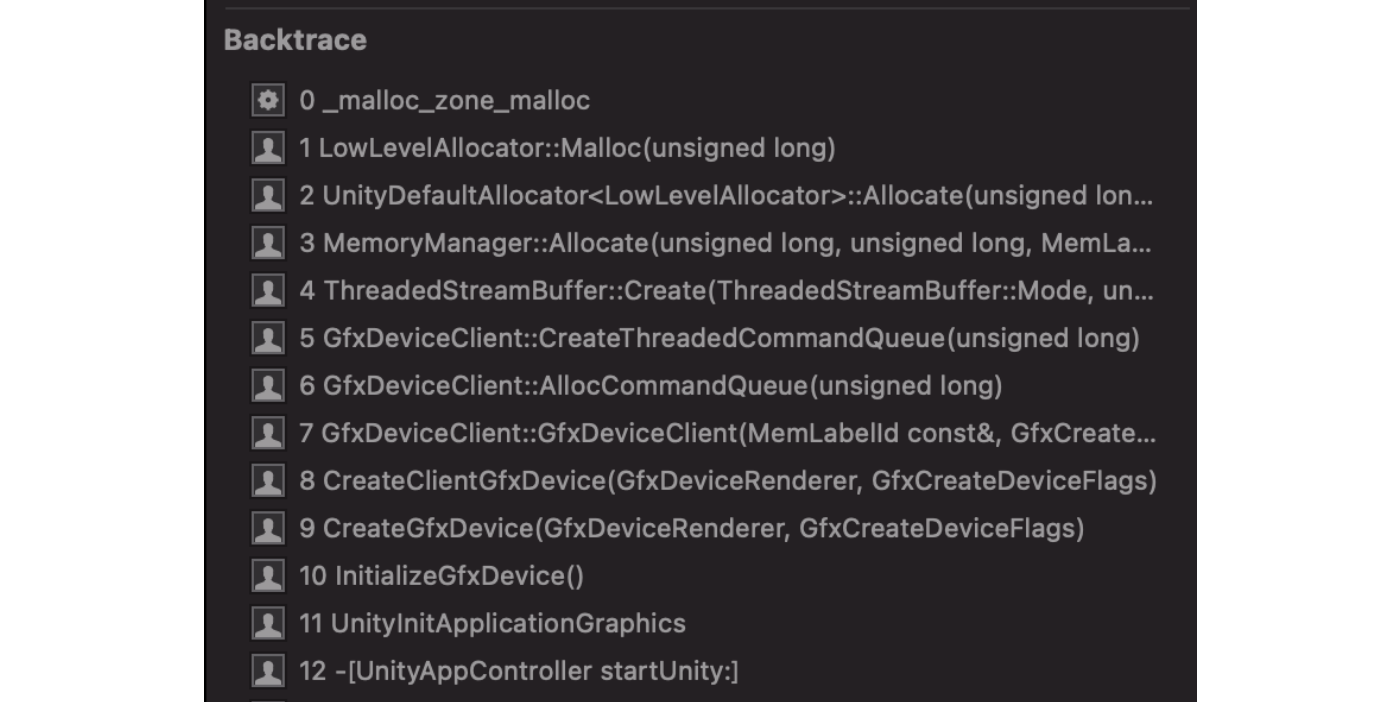
Figure 3.89: Displaying Backtrace
2. capture
Capture is performed by pressing the branch-like icon from the debug bar while the application is running.
Figure 3.90: Memory Graph Capture button
Memory Graph can be saved as a file by clicking "File -> Export MemoryGraph".You can use the vmmap command, the heap command, and the malloc_history command to further investigate this file.If you are interested, please check it out.As an example, the summary display of the vmmap command is shown below, allowing you to grasp an overall picture that was difficult to grasp with the MemoryGraph command.
List 3.5: vmmap summary command
vmmap --summary hoge.memgraph |
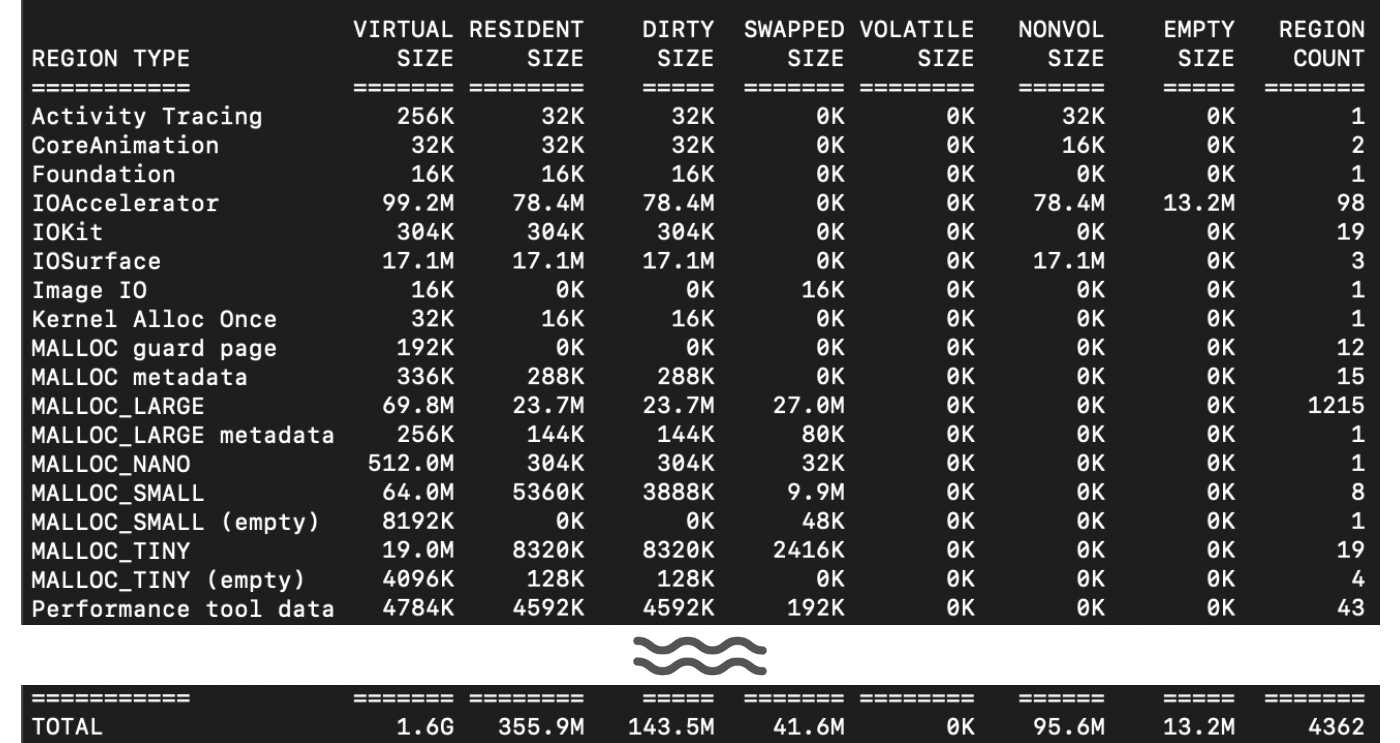
Figure 3.91: MemoryGraph Summary display
3.7. Instruments
Xcode has a tool called Instruments that specializes in detailed measurement and analysis.To build Instruments, select "Product -> Analyze".Once completed, a screen will open to select a template for the measurement items as shown below.
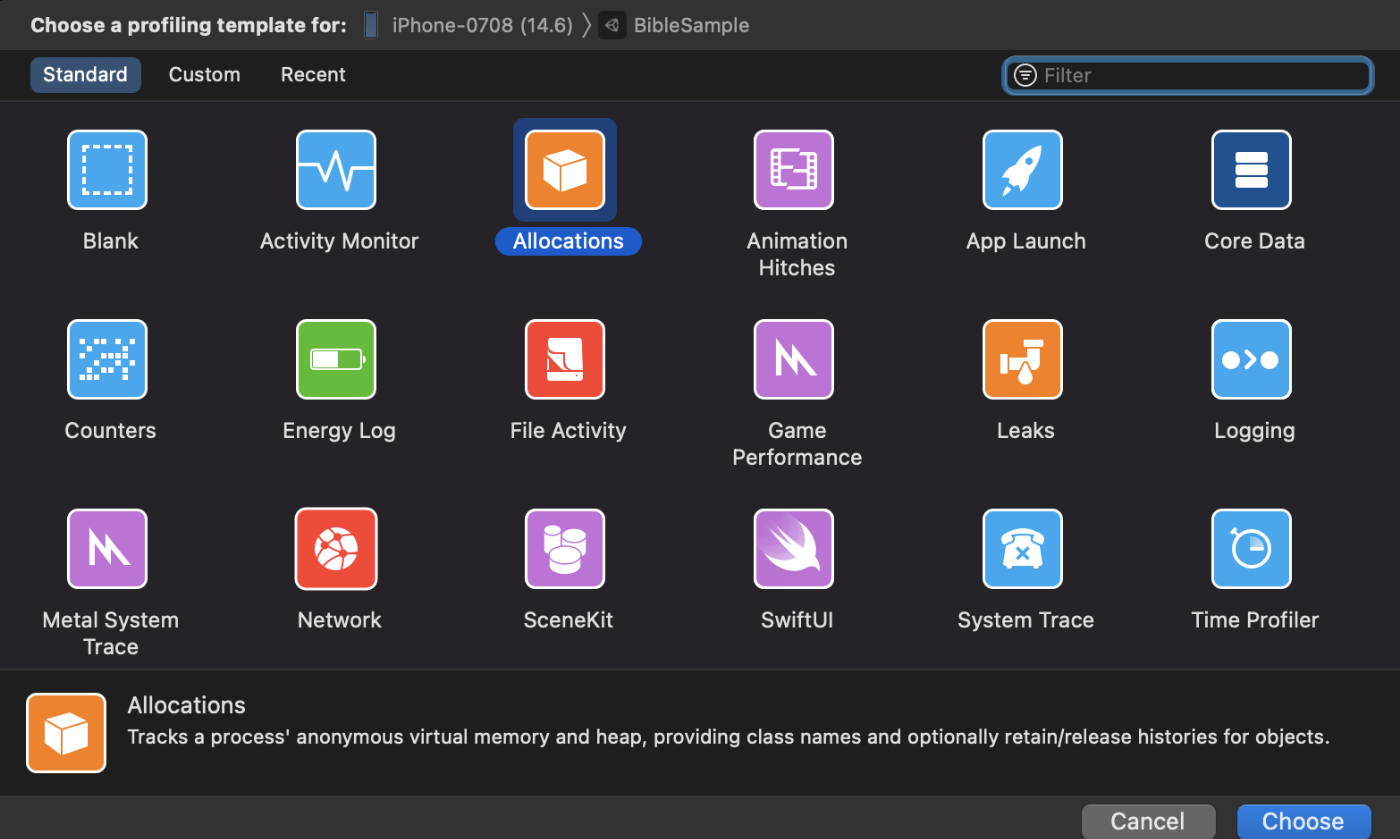
Figure 3.92: Instruments template selection screen
As you can see from the large number of templates, Instruments can analyze a wide variety of content.In this section, we will focus on "Time Profiler" and "Allocations," which are frequently used.
3.7.1. Time Profiler
The Time Profiler is a tool for measuring code execution time.Like the CPU module in the Unity Profiler, it is used to improve processing time.
To start the measurement, you need to click on the record button marked with a red circle in the Time Profiler toolbar.

Figure 3.93: Start Record button
When the measurement is performed, the display will look like Figure 3.94.
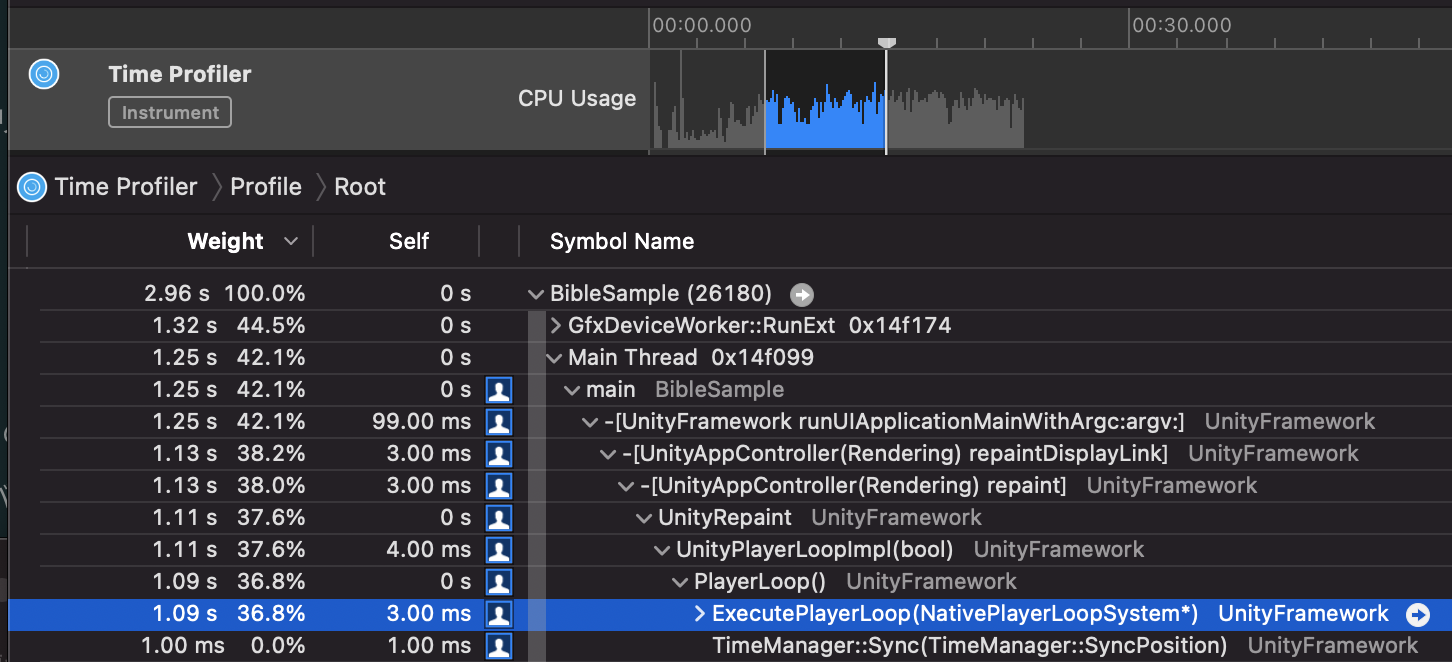
Figure 3.94: Measurement Result
Unlike the Unity Profiler, we will be analyzing not in frames, but in segments.The Tree View at the bottom shows the processing time within the interval.When optimizing the processing time of game logic, it is recommended to analyze the processing below the PlayerLoop in the Tree View.
To make the Tree View display easier to read, you should set the Call Trees setting at the bottom of Xcode like Figure 3.95.In particular, checking the Hide System Libraries checkbox hides inaccessible system code, making it easier to investigate.
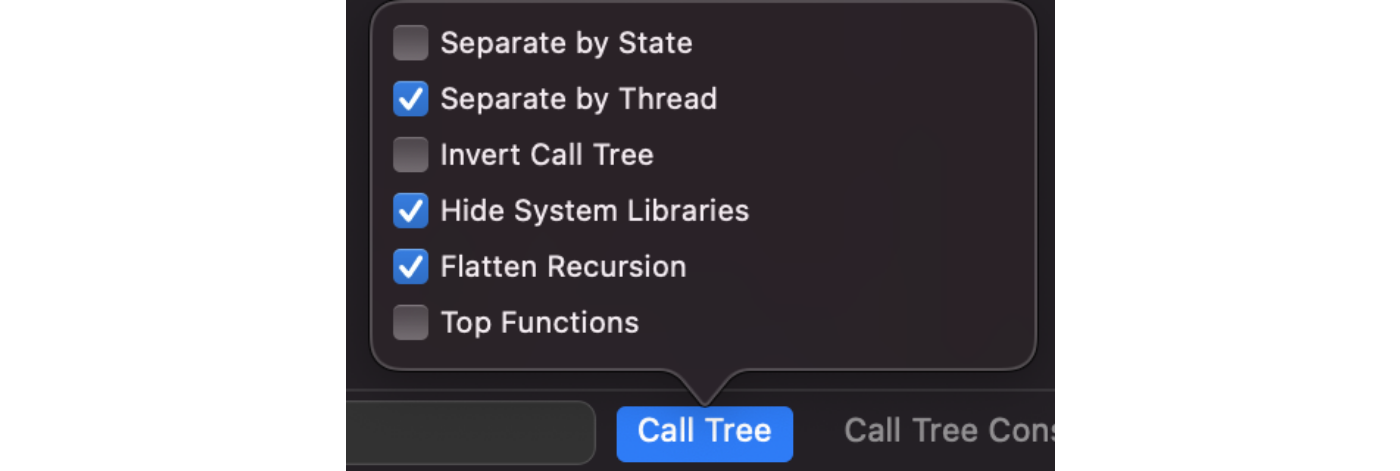
Figure 3.95: Call Trees Settings
In this way, processing times can be analyzed and optimized.
The symbol names in the Time Profiler differ from those in the Unity Profiler.The symbol names in the Time Profiler are different from those in the Unity Profiler, but they are still the same: "class_name_function_name_random_string".
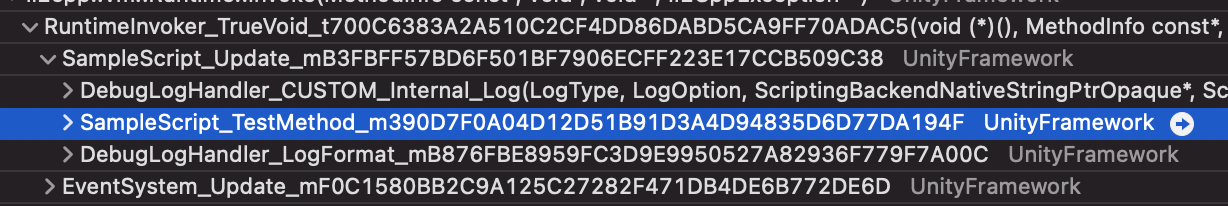
Figure 3.96: Symbol name in Time Profiler
3.7.2. Allocations
Allocations is a tool for measuring memory usage. It is used to improve memory leakage and usage.
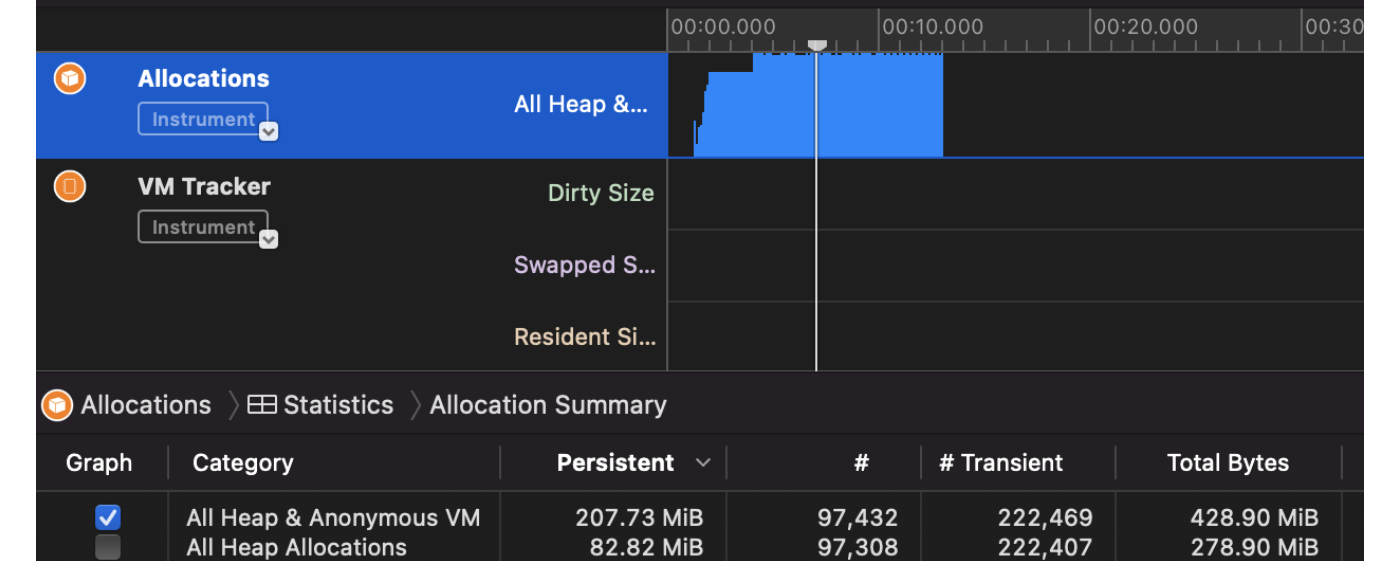
Figure 3.97: Allocations measurement screen
Before measuring, open "File -> Recording Options" and check "Discard events for freed memory".
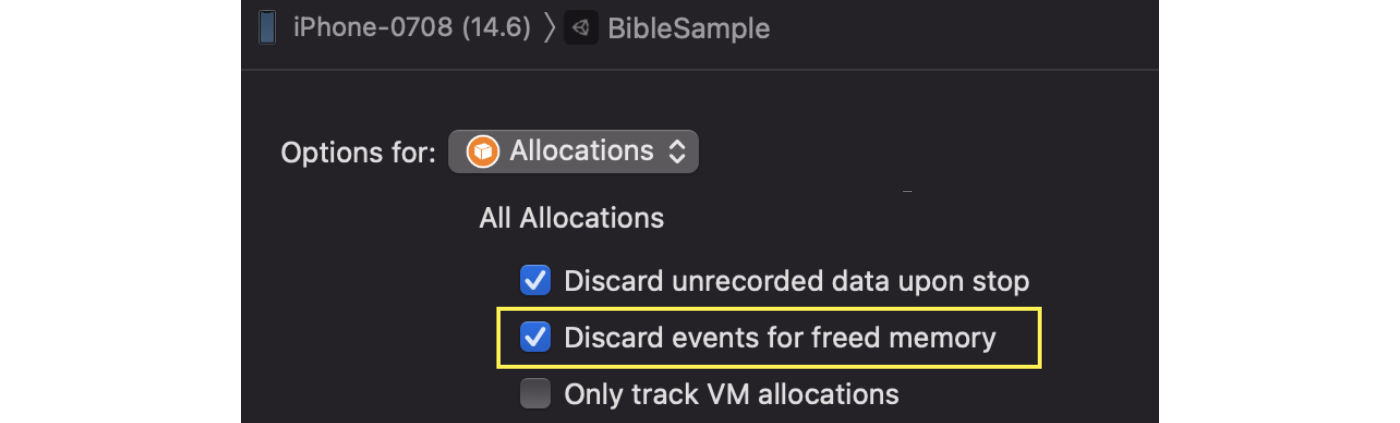
Figure 3.98: Option setting screen
If this option is enabled, the recording will be discarded when memory is freed.
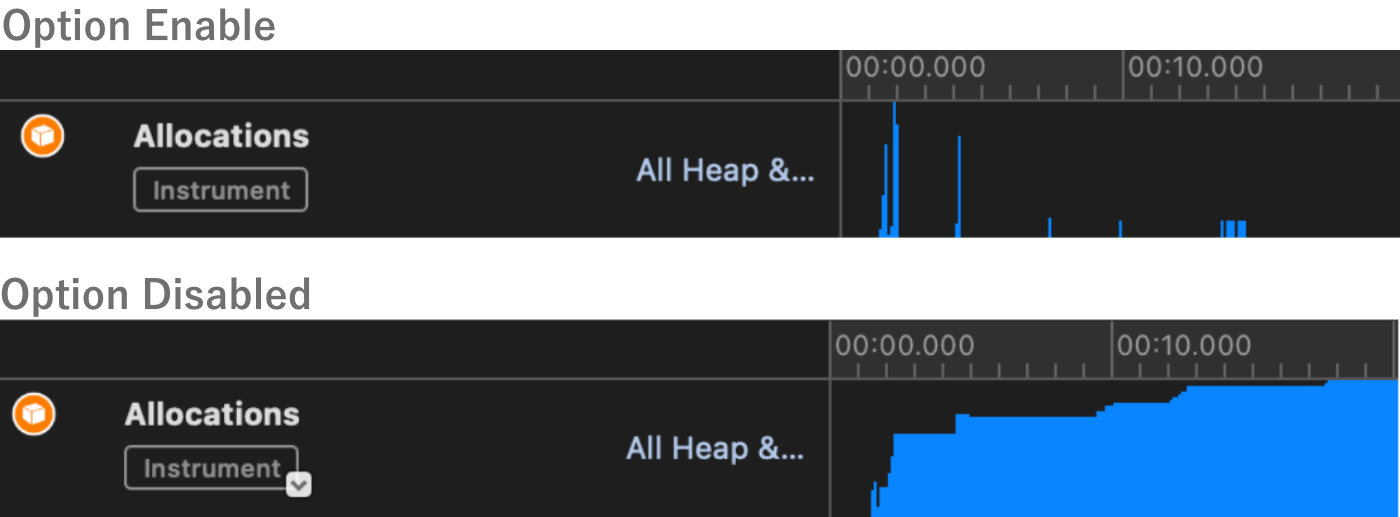
Figure 3.99: Difference by Option Setting
Figure 3.99 As you can see in Figure 1, the appearance changes significantly with and without options.With the option, lines are recorded only when memory is allocated.Also, the recorded lines are discarded when the allocated area is released.In other words, by setting this option, if a line remains in memory, it has not been released from memory.For example, in a design where memory is released by scene transitions, if many lines remain in the scene section before the transition, there is a suspicion of a memory leak.In such a case, use the Tree View to follow the details.
The Tree View at the bottom of the screen displays the details of the specified range, similar to the Time Profiler.The Tree View can be displayed in four different ways.
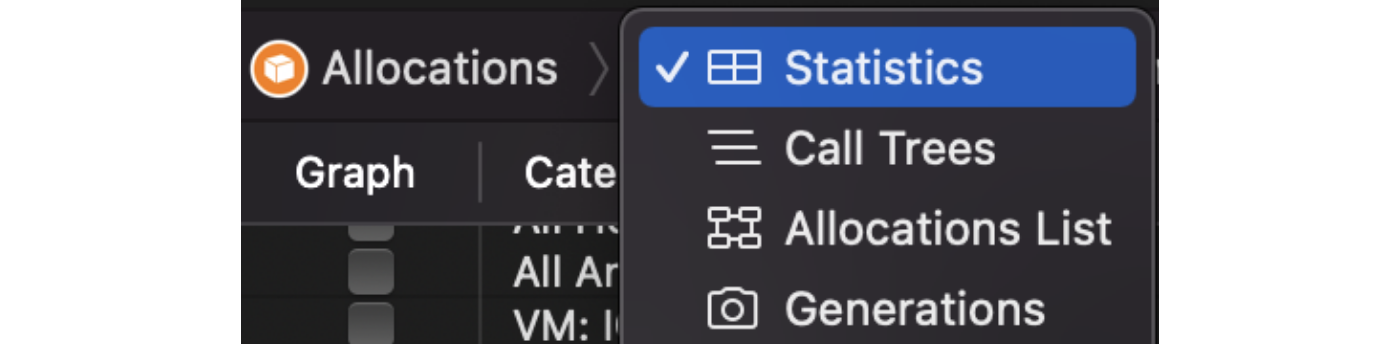
Figure 3.100: Selecting a display method
The most recommended display method is Call Trees.This allows you to follow which code caused the allocation.There are Call Trees display options at the bottom of the screen, and you can set options such as Hide System Libraries in the same way asFigure 3.95 introduced in the Time Profiler.Figure 3.101 Now we have captured the Call Trees display.You can see that 12.05MB of allocation is generated by SampleScript's OnClicked.
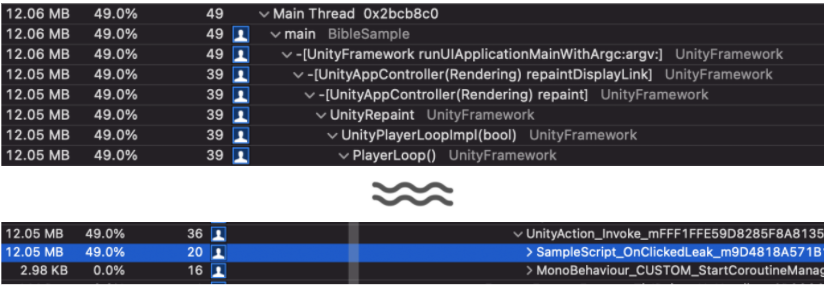
Figure 3.101: Call Tree display
Finally, let me introduce a feature called Generations.At the bottom of Xcode, there is a button called "Mark Generations.

Figure 3.102: Mark Generation button
When this button is pressed, the memory at that timing is stored.After that, pressing the "Mark Generations" button again will record the amount of memory newly allocated compared to the previous data.
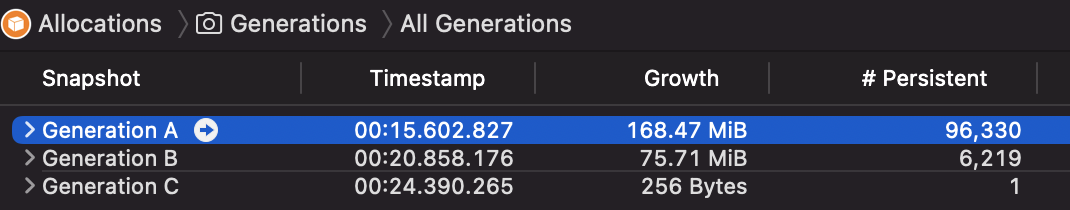
Figure 3.103: Generations
Figure 3.103 Each Generation inis displayed in a Call Tree format so that you can follow what caused the memory increase.
3.8. Android Studio
Android Studio is an integrated development environment tool for Android.This tool allows you to measure the status of your application.There are four profileable items: CPU, Memory, Network, and Energy.In this section, we will first introduce the profiling method and then explain the measurement items of CPU and Memory.
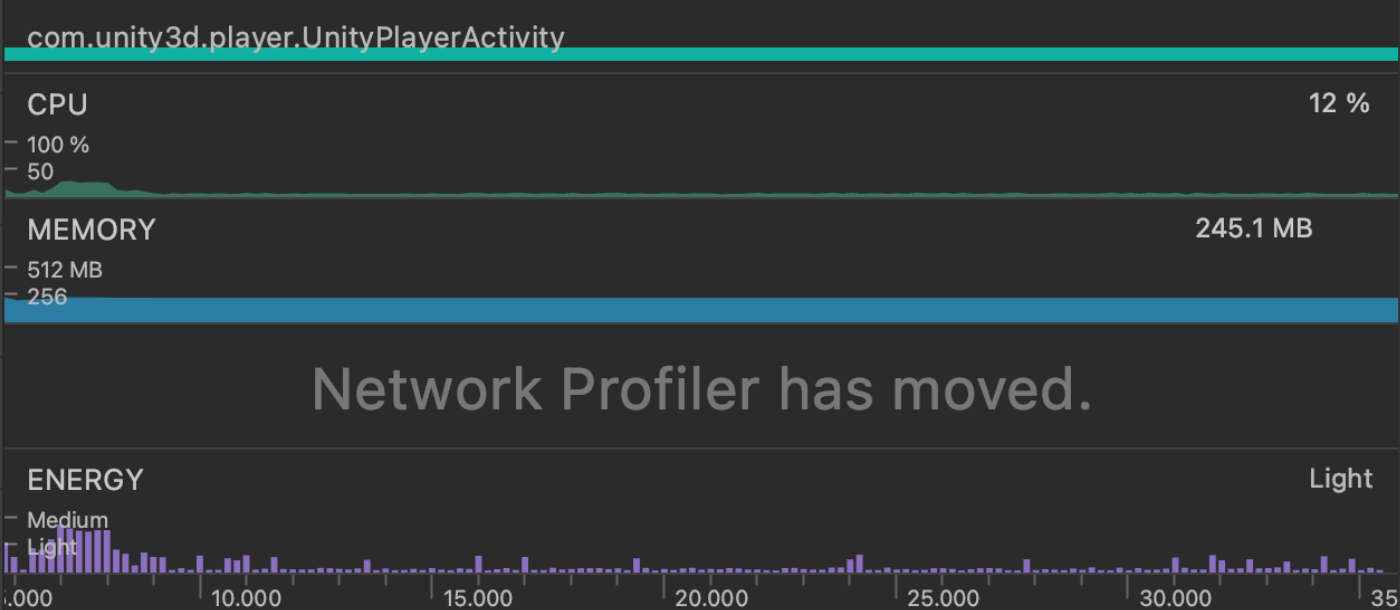
Figure 3.104: Profile screen
3.8.1. Profile Method
There are two ways to profile.The first is to build and profile via Android Studio.In this method, first export the Android Studio project from Unity.In the Build Settings, check the "Export Project" checkbox and build the project.
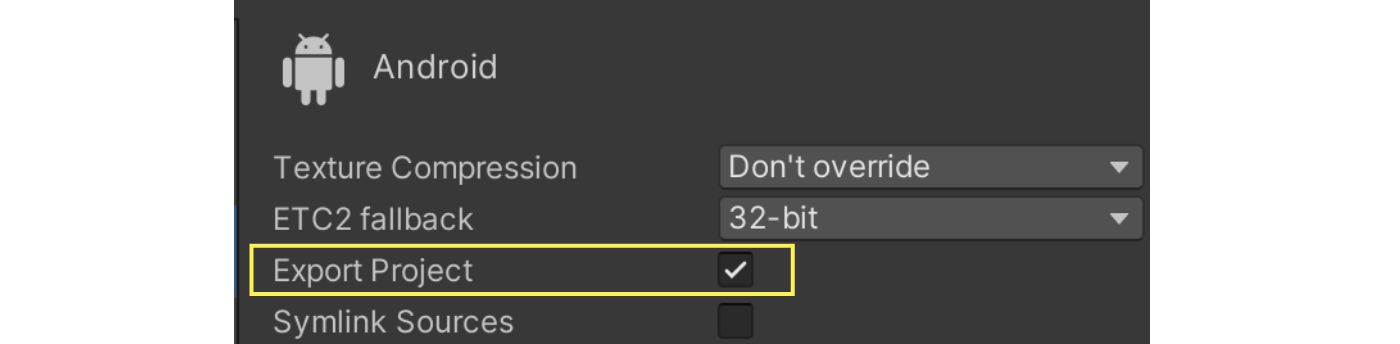
Figure 3.105: Export Project
Next, open the exported project in Android Studio.Then, with the Android device connected, press the gauge-like icon in the upper right corner to start the build.After the build is complete, the application will launch and the profile will start.

Figure 3.106: Profile start icon
The second method is to attach the running process to the debugger and measure it.First, open the Android Profiler from "View -> Tool Windows -> Profiler" in the Android Studio menu.
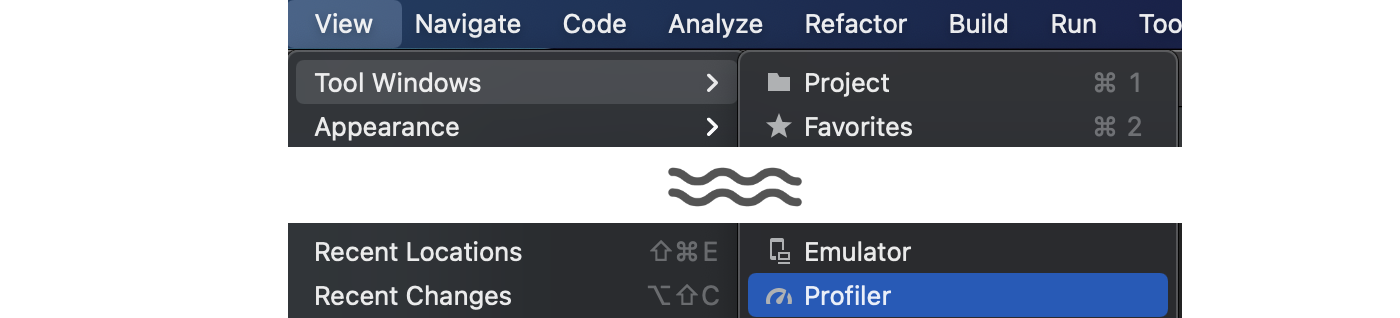
Figure 3.107: Open Android Profiler
Next, open the Profiler and click on SESSIONS in the Profiler.To connect a session, the application to be measured must be running.Also, the binary must be a Development Build.Once the session is connected, the profile will start.
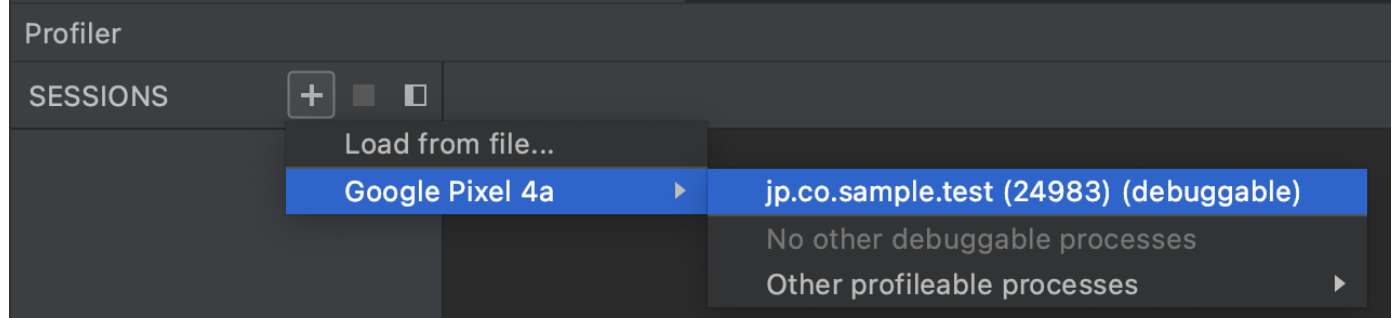
Figure 3.108: Select the SESSION to profile
The second method of attaching to the debugger is good to keep in mind because it does not require exporting the project and can be used easily.
Strictly speaking, you need to configure debuggable and profileable settings in AndroidManifest.xml, not Development Build in Unity.In Unity, debuggable is automatically set to true when you do a Development Build.
3.8.2. CPU Measurement
The CPU measurement screen looks like Figure 3.109.This screen alone does not tell you what is consuming how much processing time.To see more details, you need to select the threads you want to see in detail.
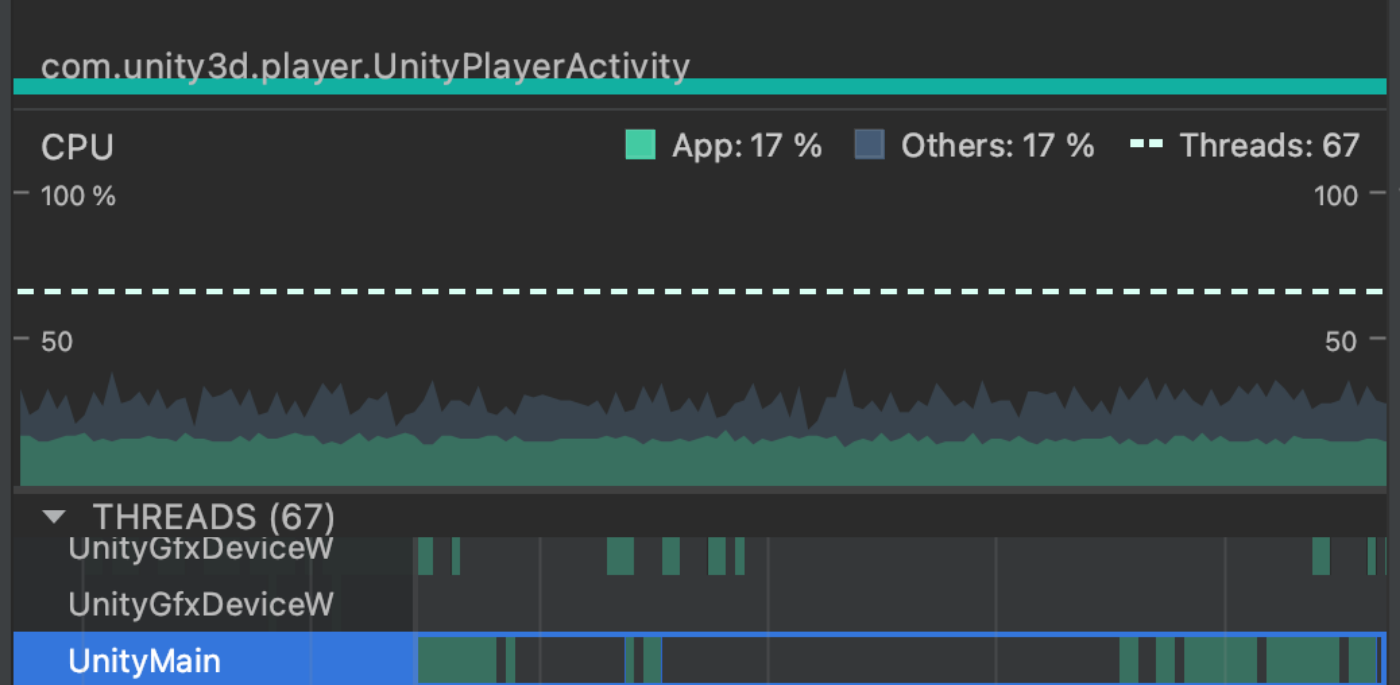
Figure 3.109: CPU measurement top screen, thread selection
After selecting a thread, press the Record button to measure the thread's call stack.Figure 3.110 There are several measurement types like "Callstack Sample Recording", but "Callstack Sample Recording" will be fine.
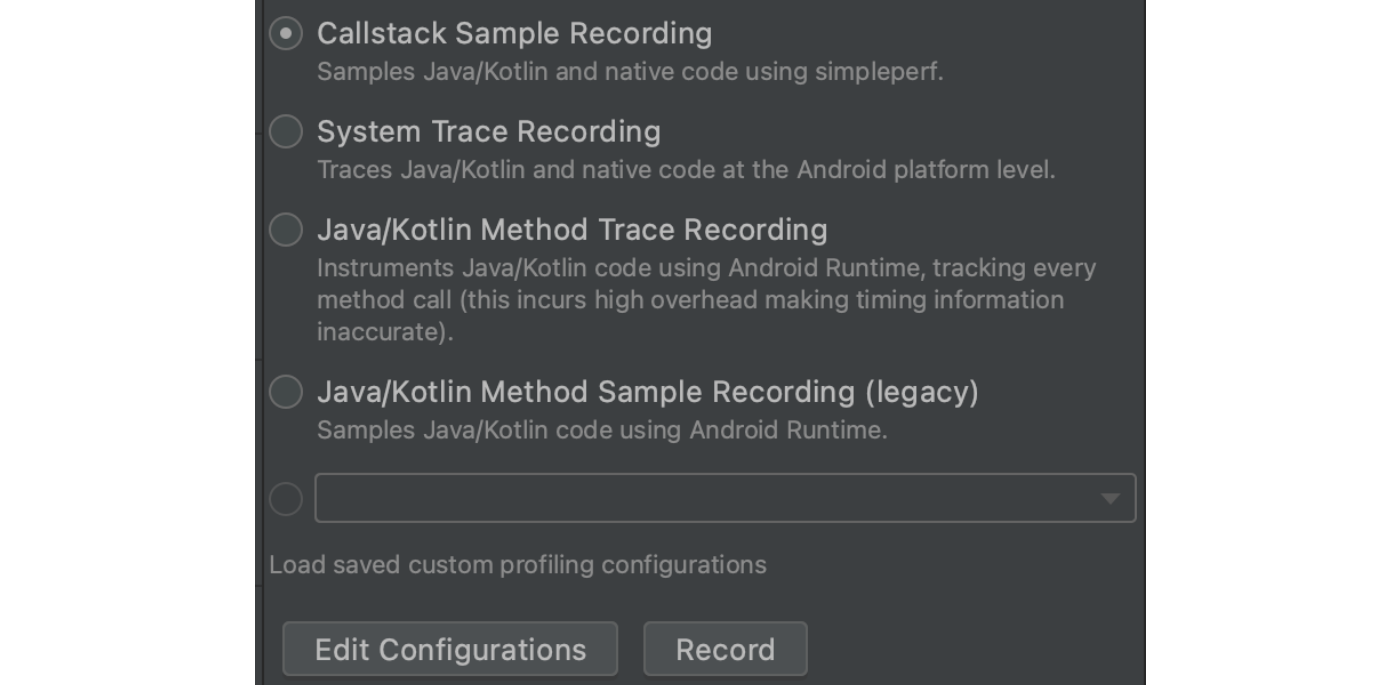
Figure 3.110: Record start button
Clicking the Stop button will end the measurement and display the results.The result screen will look like the CPU module of the Unity Profiler.
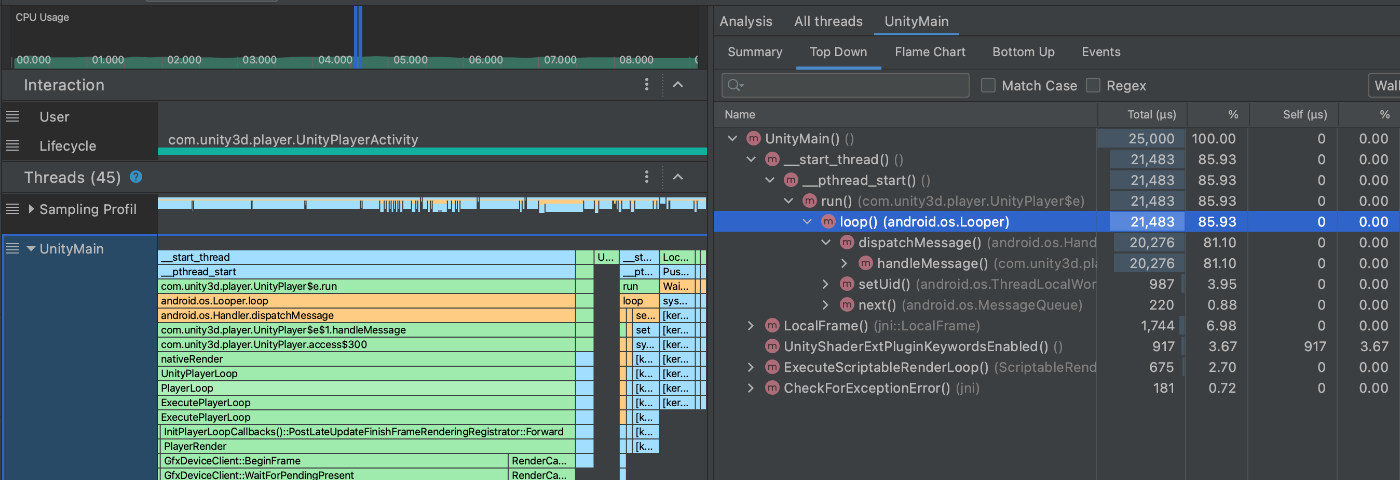
Figure 3.111: Call Stack Measurement Result Screen
3.8.3. Memory Measurement
The Memory measurement screen looks like Figure 3.112.The memory breakdown cannot be seen on this screen.
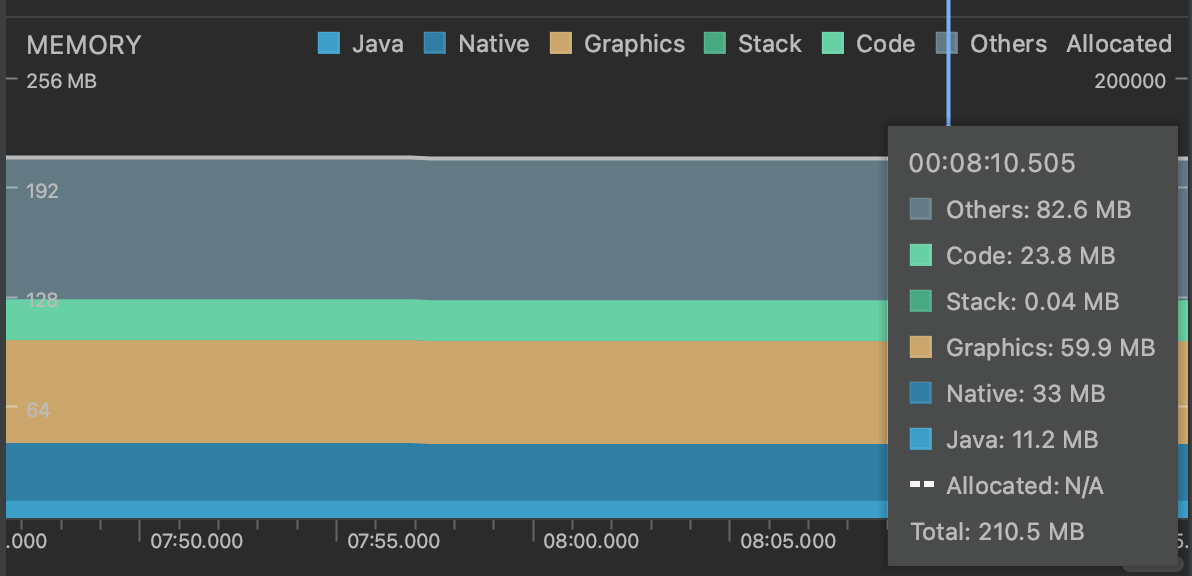
Figure 3.112: Memory measurement screen
If you want to see the breakdown of memory, you need to perform an additional measurement.There are three measurement methods. Capture heap dump" can acquire the memory information at the timing when it is pressed.Other buttons are for analyzing allocations during the measurement section.
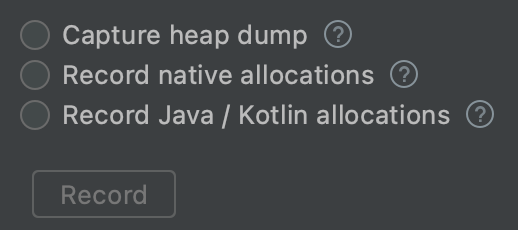
Figure 3.113: Memory measurement options
As an example, we have captured the measurement results of Heap Dump at Figure 3.114.The granularity is a bit coarse for detailed analysis, so it may be challenging.
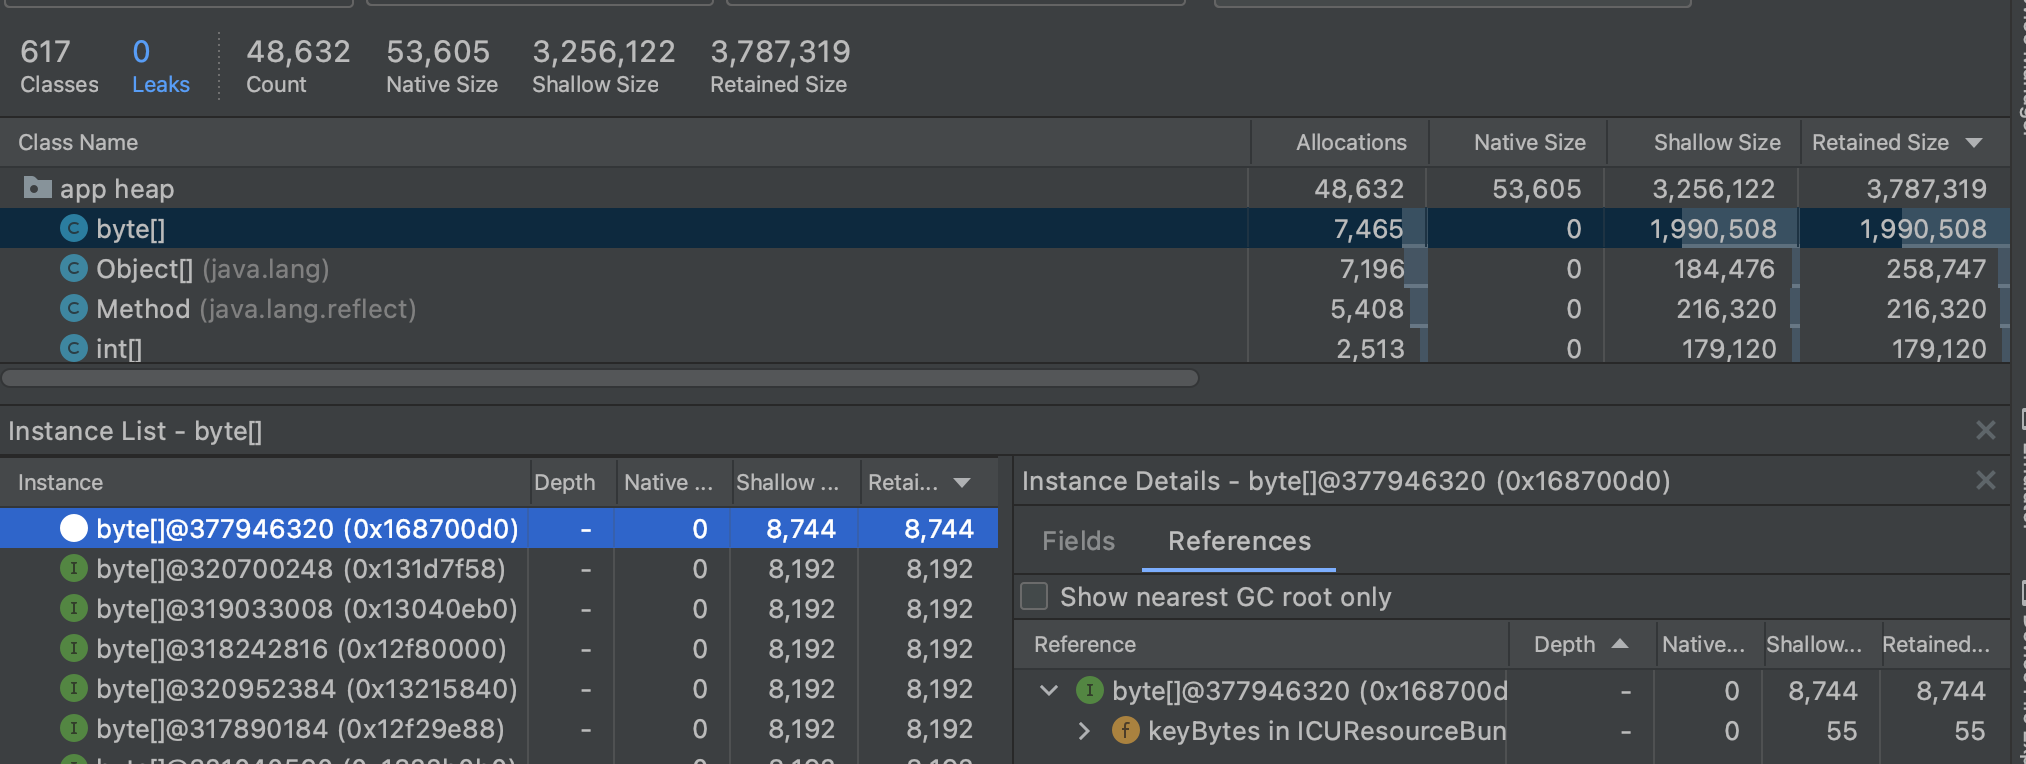
Figure 3.114: Heap Dump Results
3.9. RenderDoc
RenderDoc is an open source, free, high-quality graphics debugger tool.The tool is currently available for Windows and Linux, but not for Mac.Graphics APIs supported include Vulkan, OpenGL(ES), D3D11, and D3D12.Therefore, it can be used on Android, but not on iOS.
In this section, we will actually profile an Android application.Note, however, that there are some limitations to Android profiling.First, Android OS version 6.0 or later is required. And the application to be profiled must have Debuggable enabled.This is no problem if Development Build is selected at build time.The version of RenderDoc used for the profile is v1.18.
3.9.1. Measurement Method
First, prepare RenderDoc.Download the installer from the official website *3 and install the tool.After installation, open the RenderDoc tool.
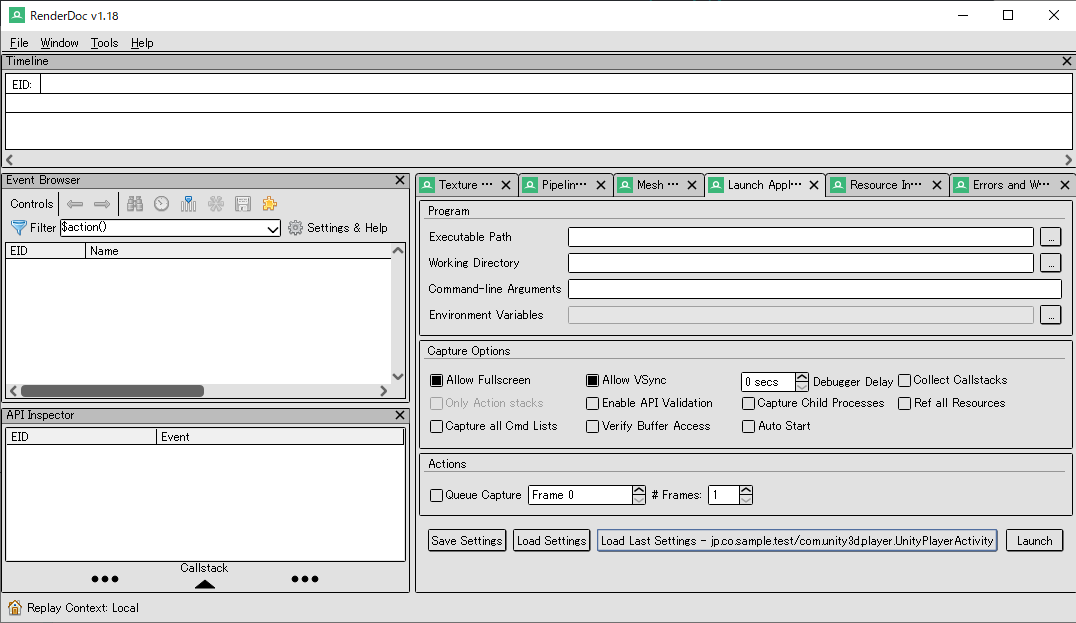
Figure 3.115: Screen after launching RenderDoc
Next, connect your Android device to RenderDoc.Click the house symbol in the lower left corner to display the list of devices connected to the PC.Select the device you want to measure from the list.

Figure 3.116: Connecting to a device
Next, select the application to be launched from the connected device.Select Launch Application from the tabs on the right side and choose the application to run from the Executable Path.
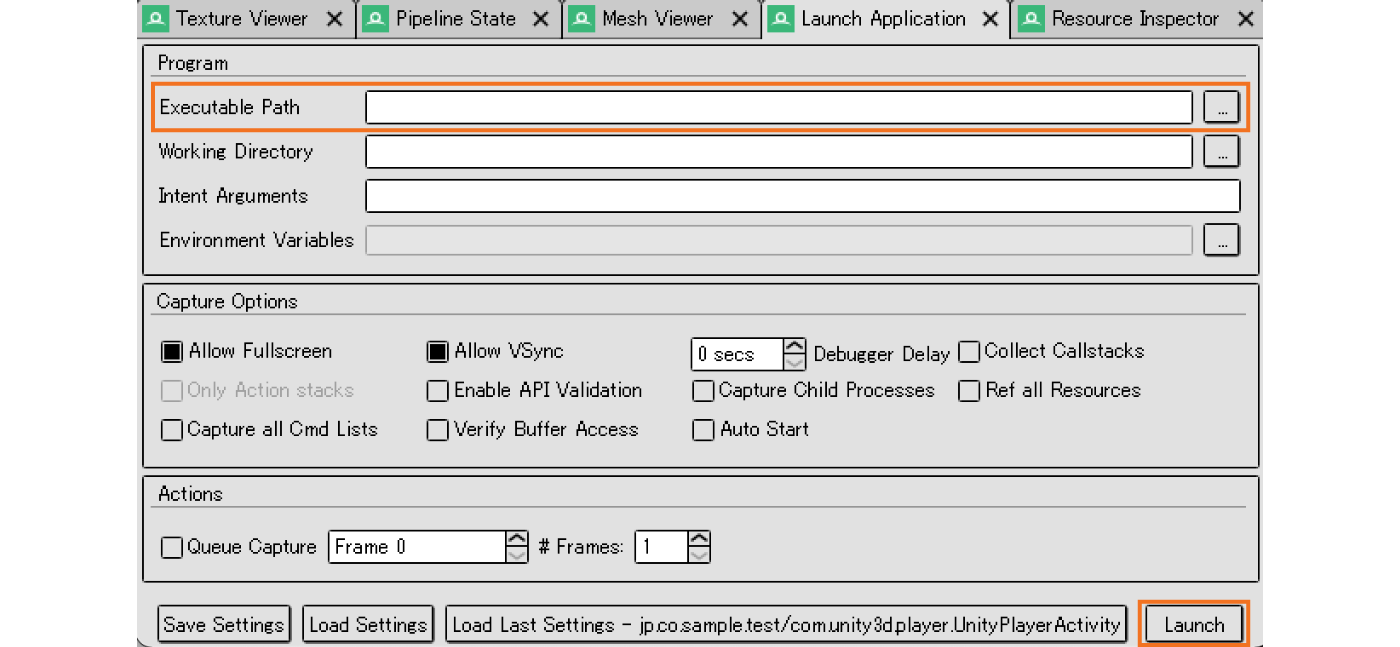
Figure 3.117: Launch Application tab Select the application to run
A File Browser window will open. Find the Pacakge Name for this measurement and select Activity.
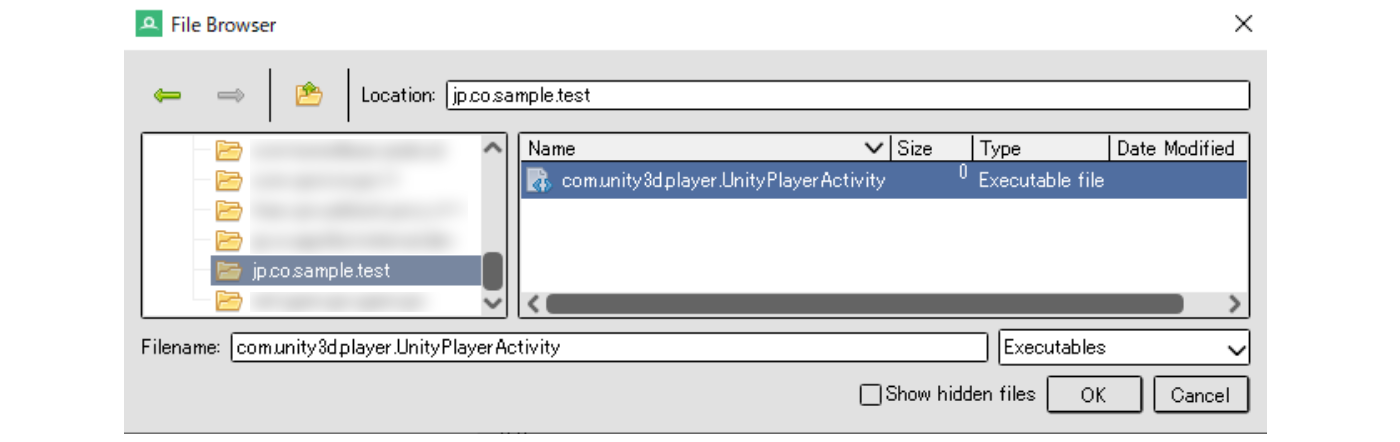
Figure 3.118: Select the application to be measured
Finally, from the Launch Application tab, click the Launch button to launch the application on the device.In addition, a new tab for measurement will be added on the RenderDoc.
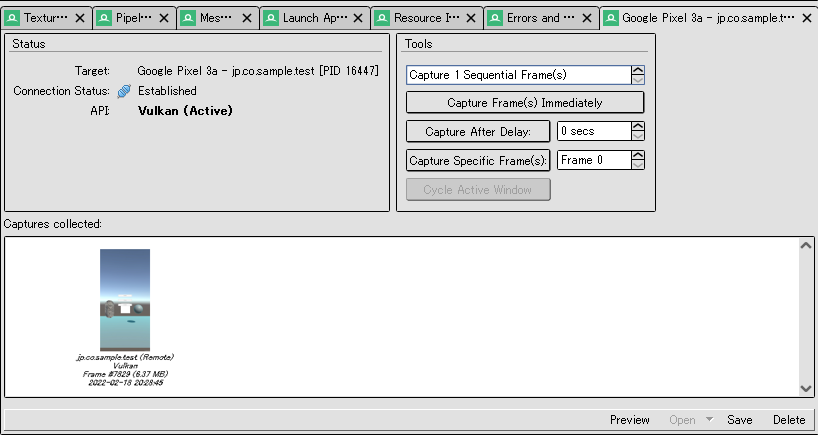
Figure 3.119: Tab for measurement
Capture Frame(s) Immediately" will capture frame data, which will be listed in the "Capture collected" tab.Double-click on this data to open the captured data.
3.9.2. How to View Capture Data
RenderDoc has a variety of functions, but in this section we will focus on the most important ones.First, a timeline of captured frames is displayed at the top of the screen.This allows you to visually capture the order in which each drawing command was performed.
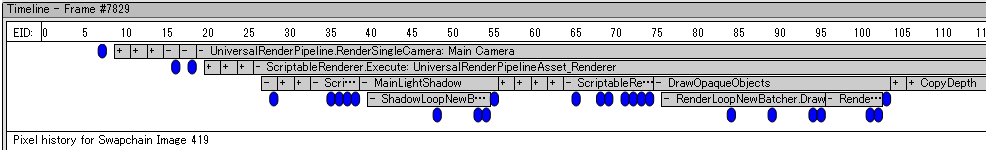
Figure 3.120: Timeline
Next is the Event Browser. Each command is listed here in order from the top.
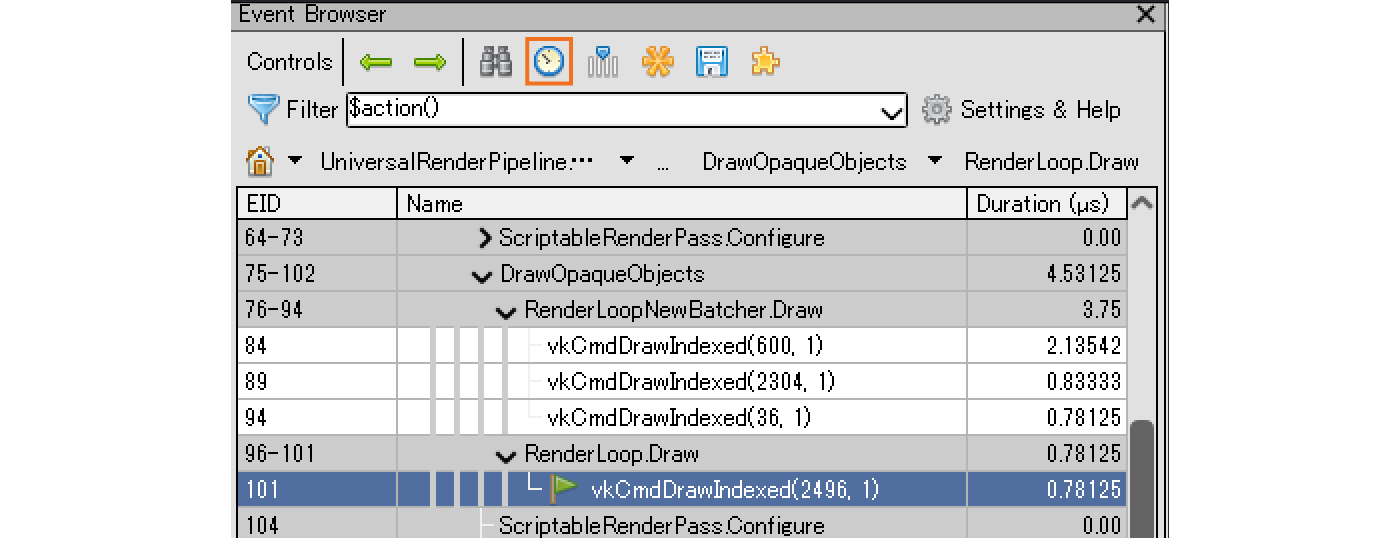
Figure 3.121: Event Browser
Clicking the "clock symbol" at the top of the Event Browser displays the processing time for each command in the "Duration" column.The processing time varies depending on the timing of the measurement, so it is best to consider it as a rough estimate.The breakdown of the DrawOpaqueObjects command shows that three commands are batch processed and only one is drawn out of batch.
Next, let's look at the tabs on the right side of the window.In this tab, there is a window where you can check detailed information about the command selected in the Event Browser.The three most important windows are the Mesh Viewer, Texture Viewer, and Pipeline State.

Figure 3.122: Each window
First, let's look at Pipeline State.Pipeline State allows you to see what parameters were used in each shader stage before the object was rendered to the screen.You can also view the shaders used and their contents.
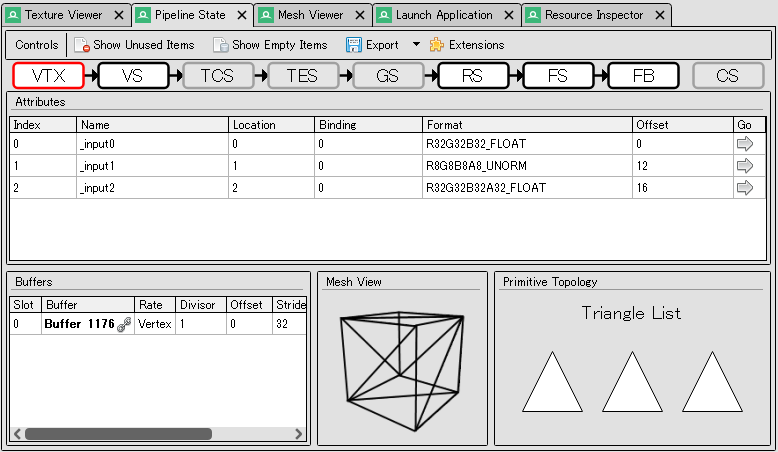
Figure 3.123: Pipieline State
The stage names displayed in the Pipeline State are abbreviated, so the official names are summarized at Table 3.7.
Table 3.7: Official name of PipielineState
| Stage Name | Official name |
|---|---|
| VTX | Vertex Input |
| VS | Vertex Shader |
| TCS | Tessellation Control Shader |
| TES | Tessellation Evaluation Shader |
| GS | Geometry Shader |
| Rasterizer | Rasterizer |
| FS | Fragment Shader |
| Frame Buffer | Frame Buffer |
| Frame Buffer | Compute Shader |
Figure 3.123 The VTX stage is selected at , where you can see the topology and vertex input data.Other FB stages at Figure 3.124 allow you to see details such as the state of the output destination texture and Blend State.
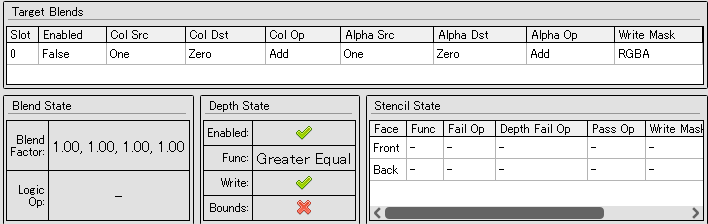
Figure 3.124: FB (Frame Buffer) State
You can also check the FS stage at Figure 3.125 to see the textures and parameters used in the fragment shader.
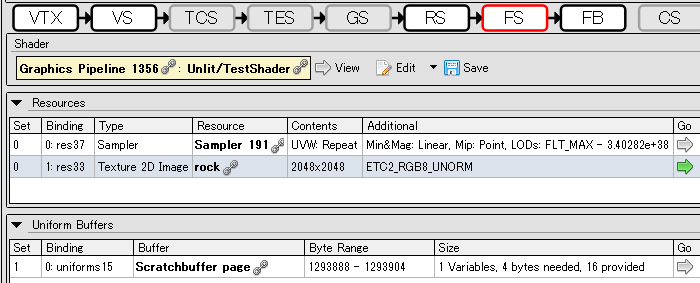
Figure 3.125: State of FS (Fragment Shader)
Resources in the center of the FS stage shows the textures and samplers used.Uniform Buffers at the bottom of the FS stage shows the CBuffer. This CBuffer contains numerical properties such as float and color.To the right of each item, there is a "Go" arrow icon, which can be pressed to see the details of the data.
The shader used is shown in the upper part of the FS stage, and the shader code can be viewed by pressing View.Disassembly type GLSL is recommended to make the display easier to understand.
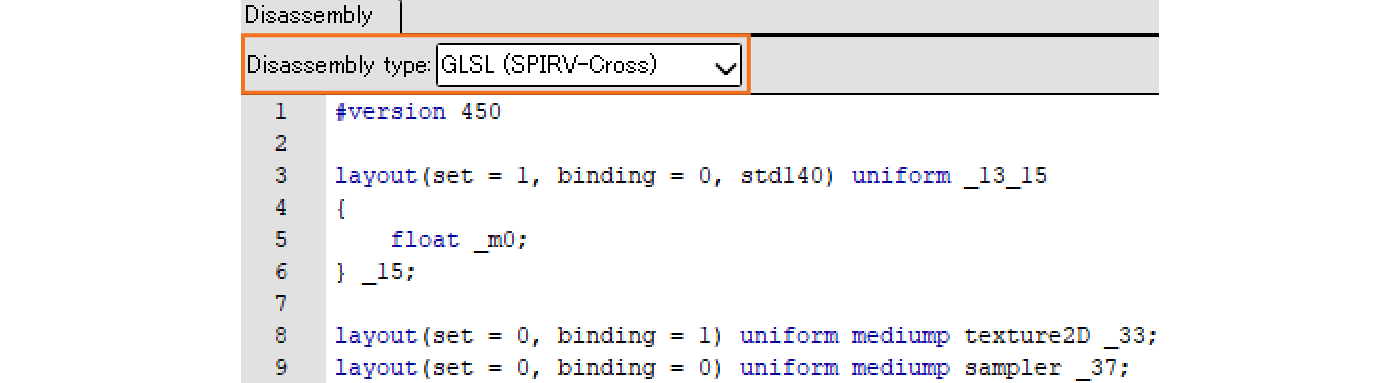
Figure 3.126: Confirmation of Shader Code
Next is the Mesh Viewer. This function allows you to visually view mesh information, which is useful for optimization and debugging.
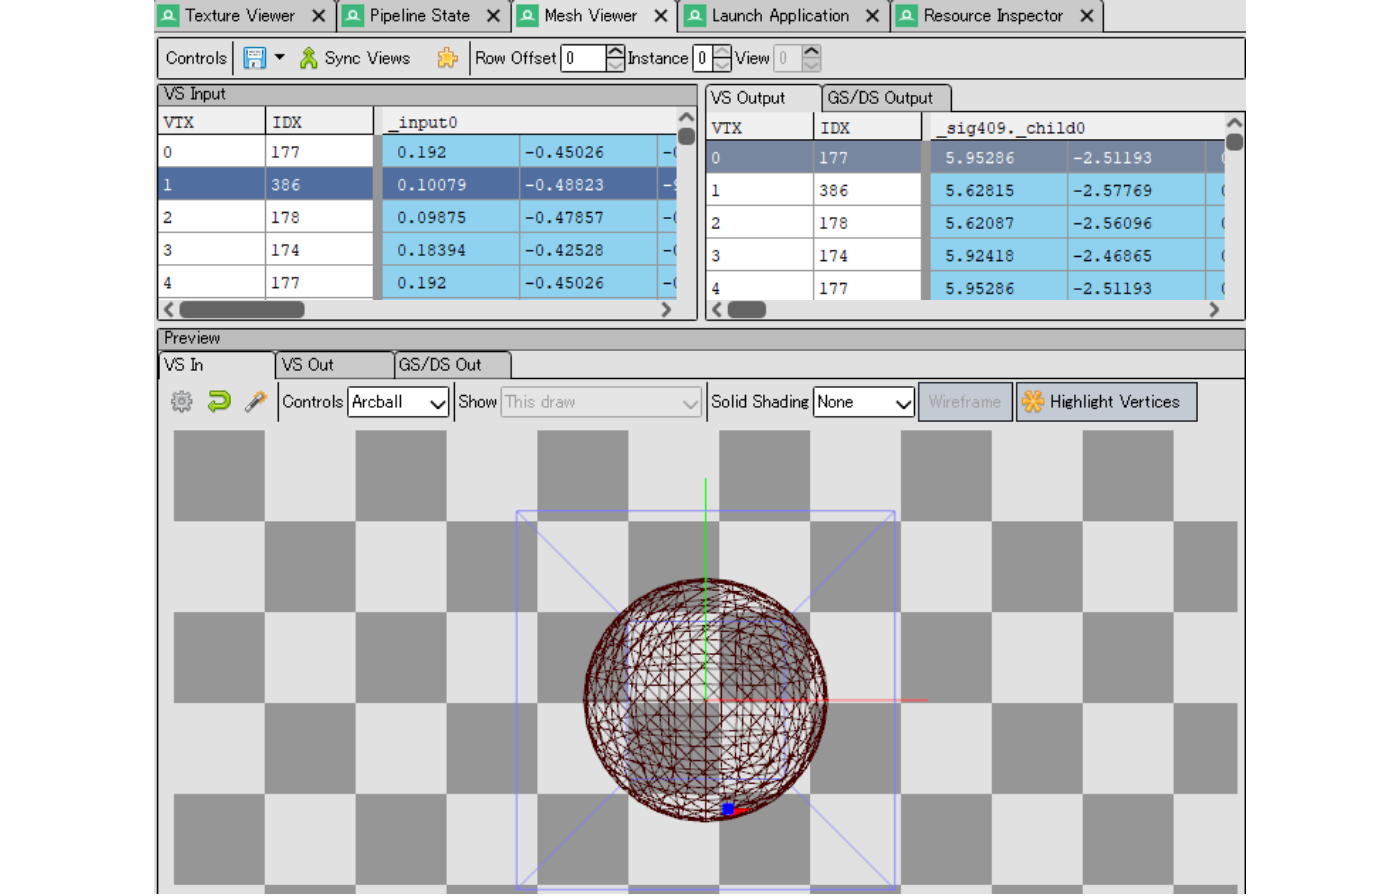
Figure 3.127: Mesh Viewer
The upper part of the Mesh Viewer shows mesh vertex information in a table format.The lower part of the Mesh Viewer has a preview screen where you can move the camera to check the shape of the mesh.Both tabs are divided into In and Out tabs, so you can see how the values and appearance have changed before and after the conversion.
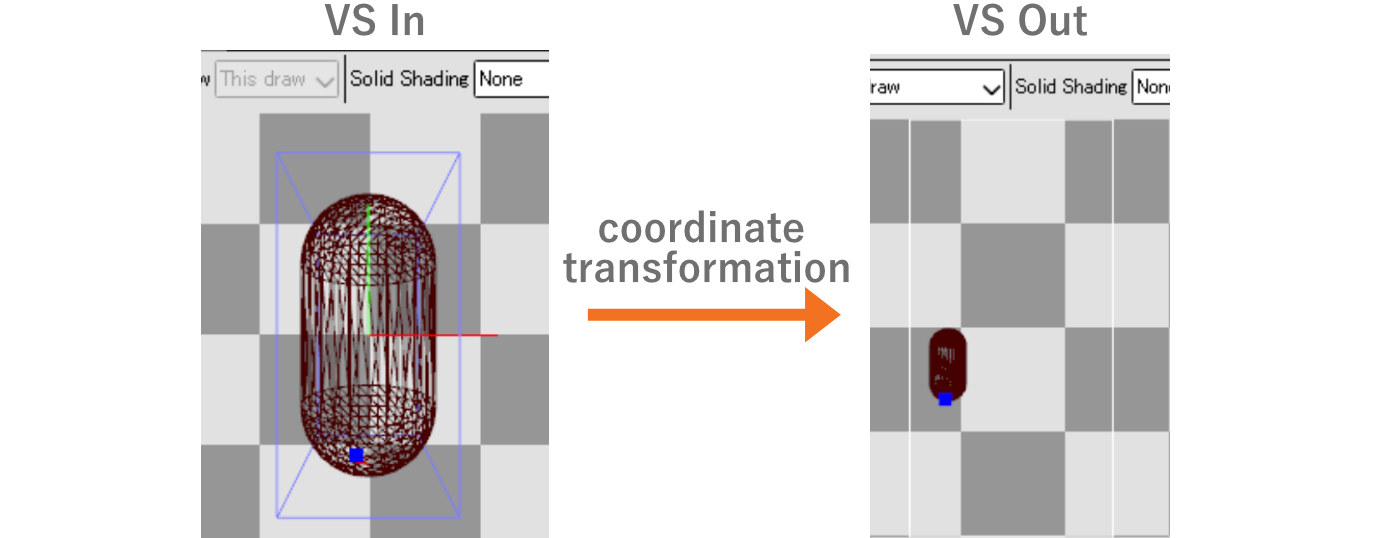
Figure 3.128: Preview display of In and Out in Mesh Viewer
Finally, there is the Texture Viewer.This screen shows the "texture used for input" and "output result" of the command selected in the Event Browser.
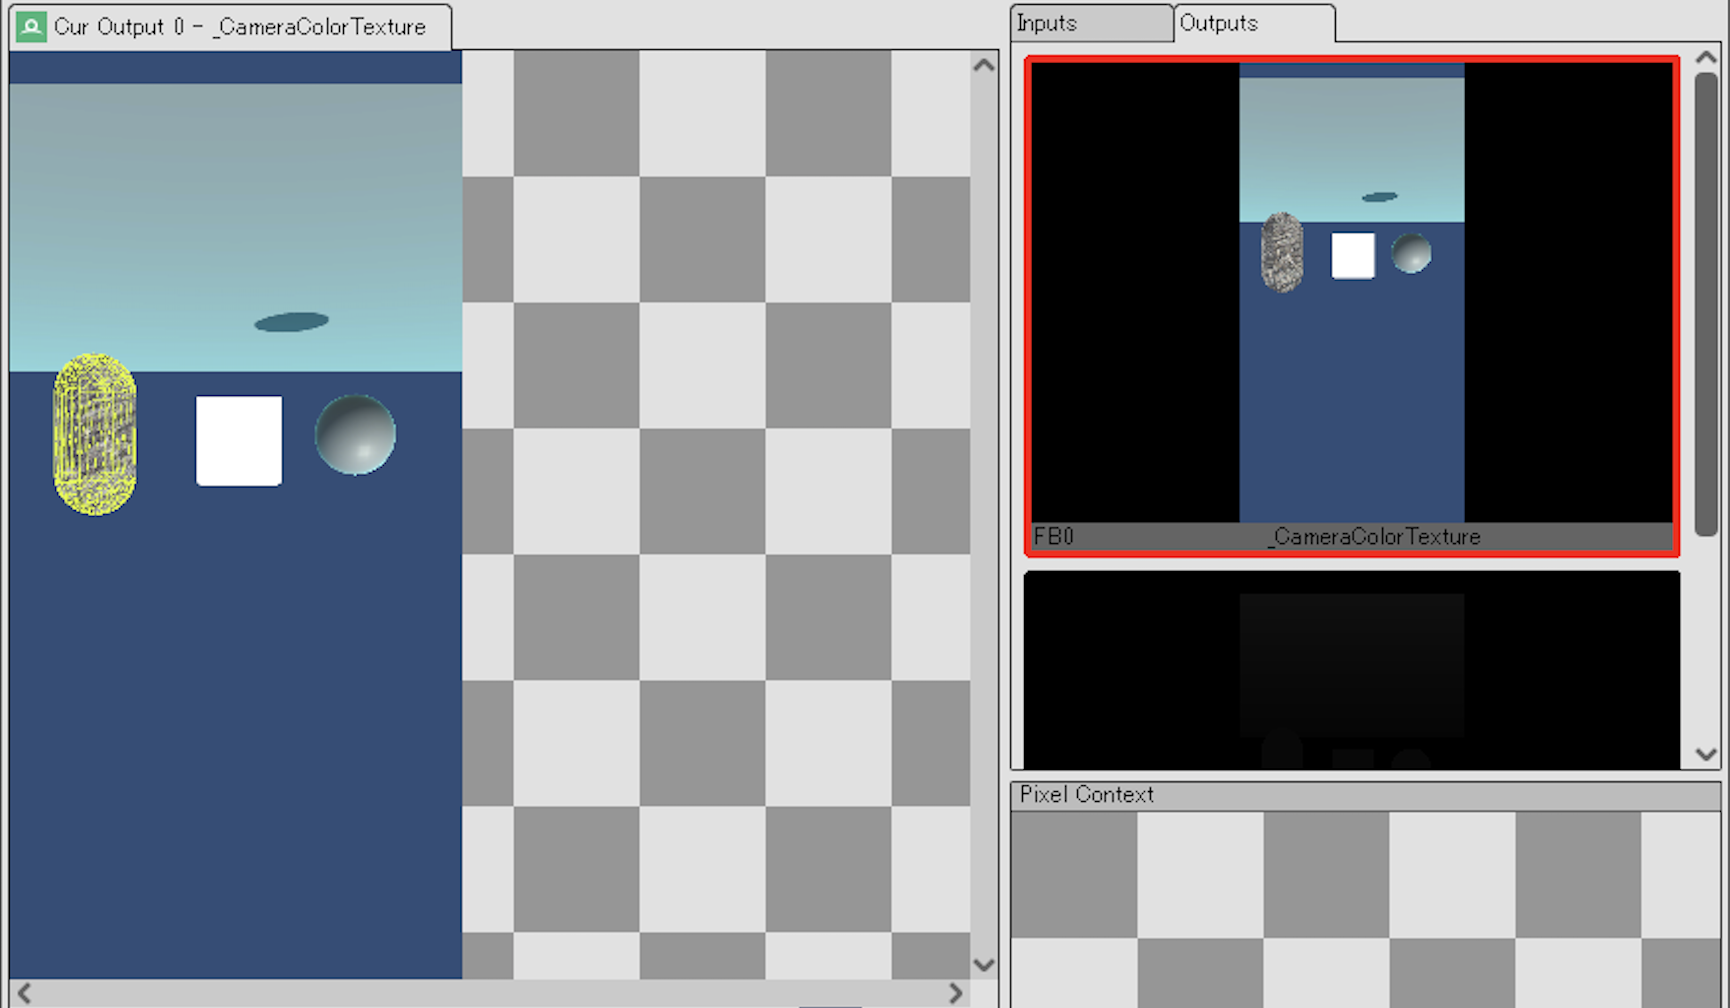
Figure 3.129: Texture Viewer Texture Confirmation Screen
In the area on the right side of the screen, you can check the input and output textures. Clicking on the displayed texture will reflect it in the area on the left side of the screen.The left side of the screen not only displays the texture, but also allows you to filter the color channels and apply toolbar settings.
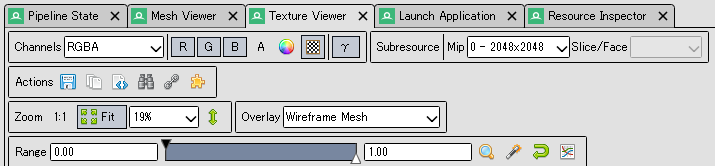
Figure 3.130: Texture Viewer Toolbar
Figure 3.129 In the example above, "Wireframe Mesh" was selected for the Overlay, so the object drawn with this commandhas a yellow wireframe display, making it easy to see visually.
Texture Viewer also has a feature called Pixel Context.This function allows the user to view the drawing history of selected pixels.The history allows the user to determine how often a pixel has been filled.This is a useful feature for overdraw investigation and optimization.However, since it is on a per-pixel basis, it is not suitable for investigating overdraw on a global basis.To investigate, right-click on the area you want to investigate on the left side of Figure 3.129, and the location will be reflected in the Pixel Context.
Figure 3.131: Reflection in Pixel Context
Next, click the History button in the Pixel Context to see the drawing history of the pixel.
Figure 3.132: Pixel Drawing History
Figure 3.132 In the following section, there are four histories.The green line indicates that the pixel passed all the pipeline tests, such as the depth test, and was painted. If some of the tests failed and the pixel was not rendered, it will be red.In the captured image, the screen clearing process and capsule drawing were successful, while the Plane and Skybox failed the depth test.