Problem-Based Reverse Lookup Guide
For each symptom, this guide lists the values to check first and the chapters that cover it. Start by reviewing how to proceed with measurement, and then look up problems in the order of size, memory, CPU, and GPU.
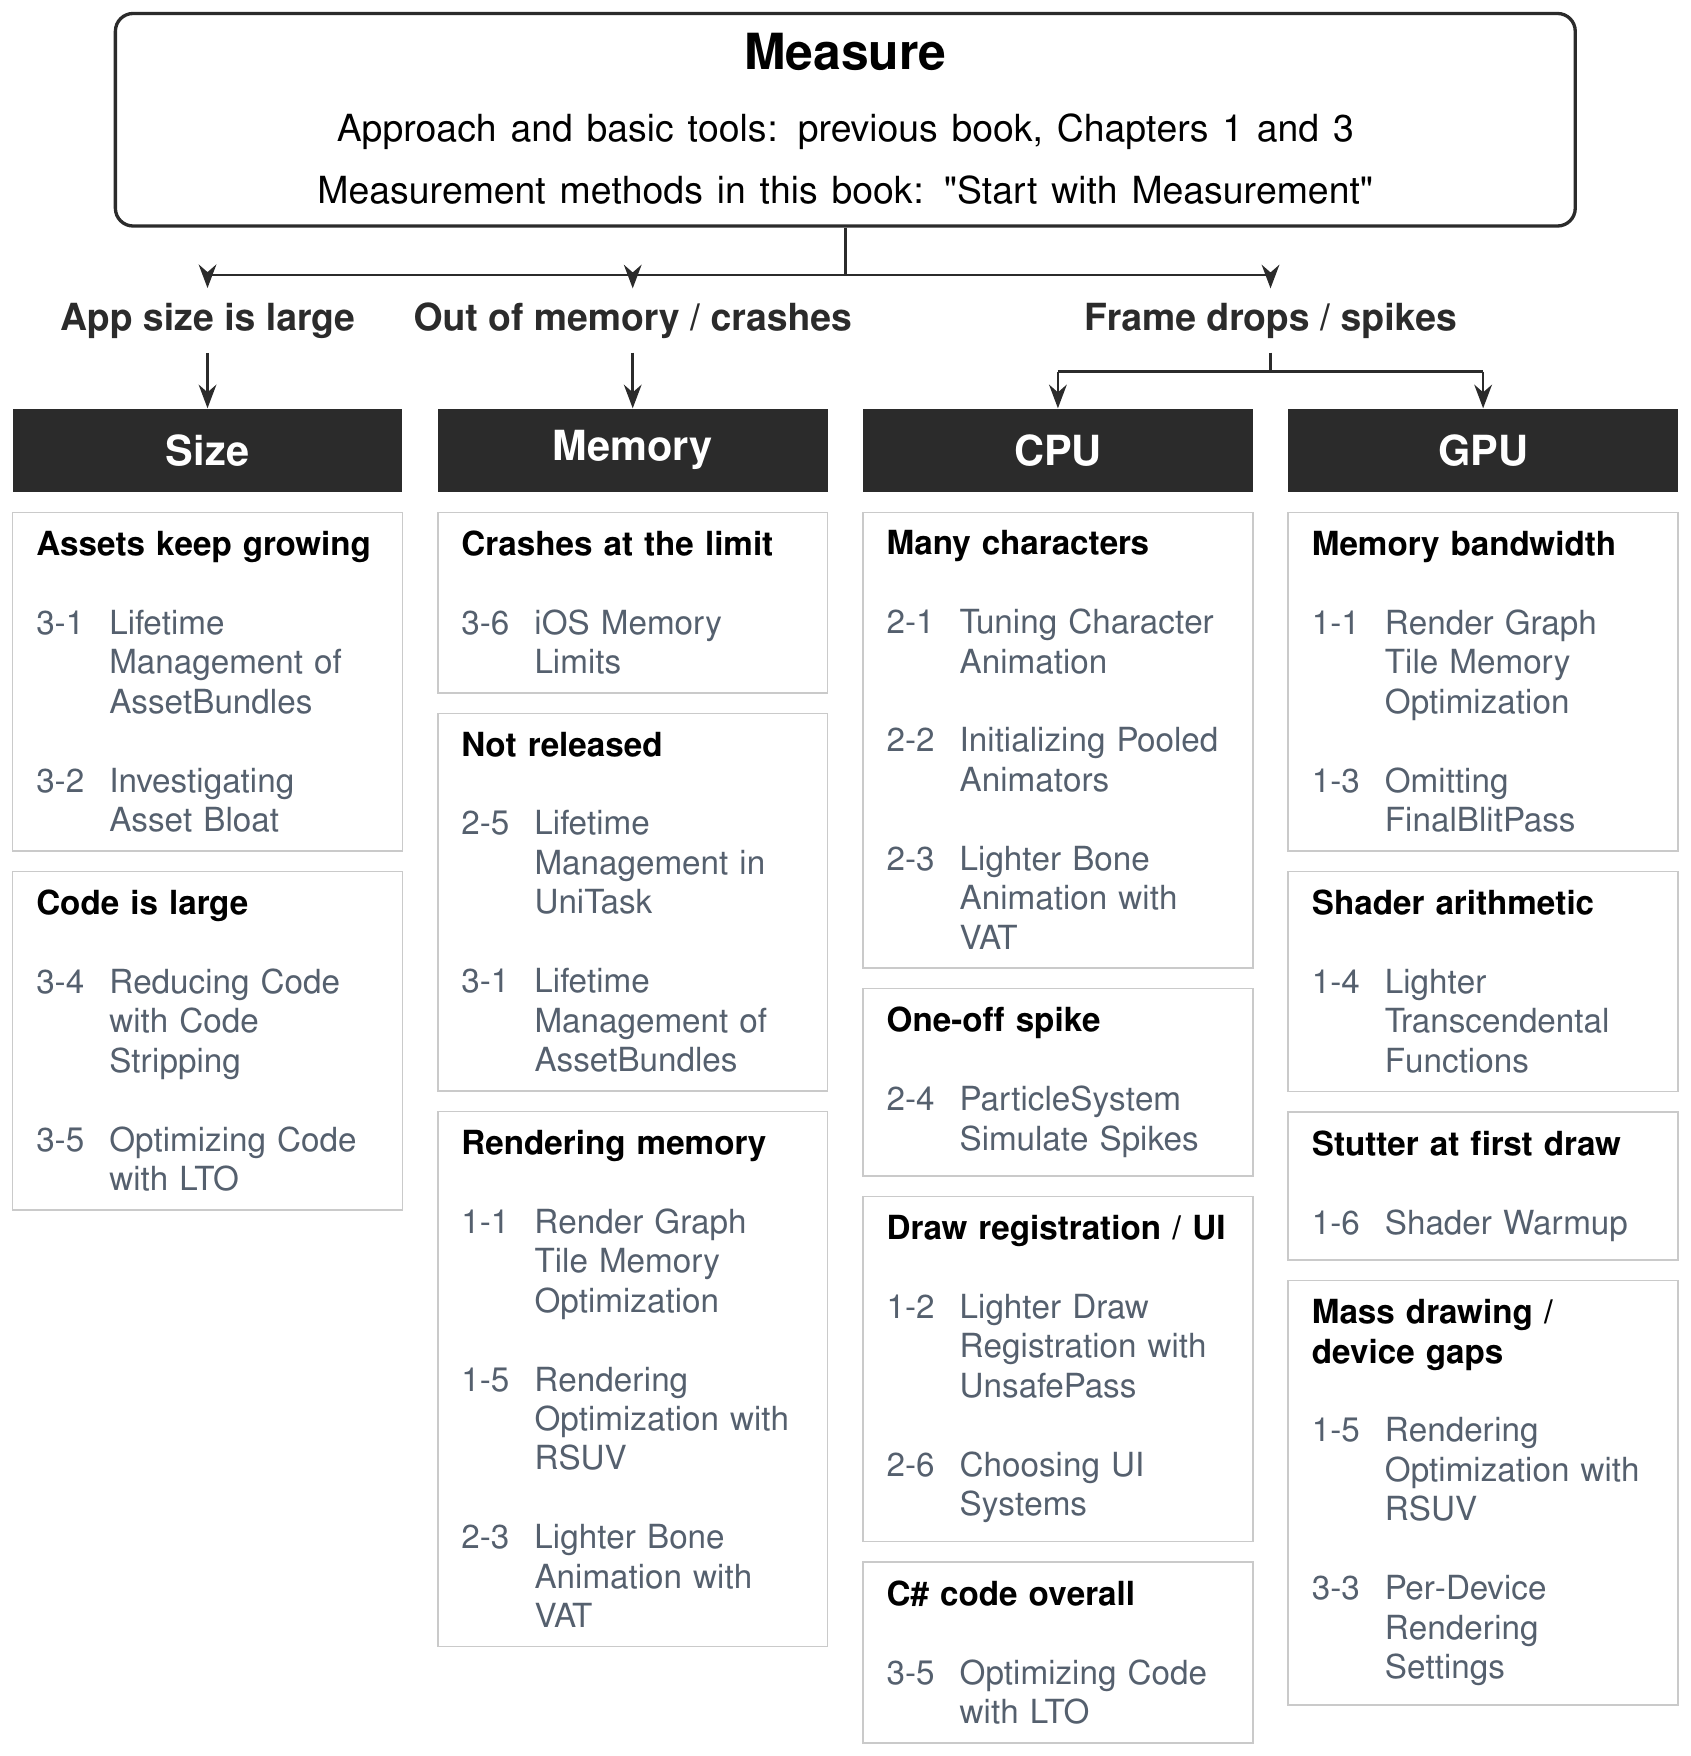
Start with Measurement
Decide where the slowness is before making changes. The previous book, Unity Performance Tuning Bible, explained in Chapter 1, "Let's Start Performance Tuning", the approach of identifying causes by measurement rather than guesswork and comparing results before and after a fix, as well as how to isolate memory overruns and dropped frames. Basic usage of Unity Profiler, Frame Debugger, RenderDoc, and other tools is also summarized in Chapter 3, "Profiling Tools".
Here we introduce measurement methods not covered in the previous book and items that can now be checked with existing tools.For iOS, Metal Performance HUD and Performance Trace can be used without depending on the Development Build flag, so you can get a rough idea of the load even before measurement code is embedded or with a configuration close to the release build.
(Part 4, Chapter 1, "iOS Built-in Performance Measurement Features for Unity")
On the rendering side, check the state of the pipeline before measuring. Frame Debugger shows whether passes are merged through the (RP n:m) notation in event names, and Render Graph Viewer displays the load/store actions and memoryless state of each attachment, as well as the reason a pass was not merged (Pass Break Reasoning).When you want to cross-check what Unity displays against the values passed to the driver, capture Vulkan with RenderDoc and check loadOp / storeOp at the API level.
(Part 1, Chapter 1, "Unity 6 Render Graph Tile Memory Optimization")
If you run measurement itself every day, one setup uses a physical device borrowed from a device farm, navigates screens through in-app remote operation, and sends a memory snapshot and a filtered Profiler capture for every build. It also covers how frames are narrowed down on the device, how to decide thresholds, and how to fit a long tour within device storage.
(Part 4, Chapter 2, "Automating Physical-Device Profiling of Daily Builds")
If you want it to take effect at the review stage rather than at measurement, you can convert the knowledge in this book itself into evaluation rules for an AI coding agent. It introduces a case where the 77 rules of the previous book were combined with 86 rules from this book into 163 rules and turned into a skill.
(Part 4, Chapter 3, "Turning the Tuning Bible into a Skill for AI Coding Agents")
Size
For app size, classifying the causes of growth stops it faster than trimming individual assets first. Four causes can be determined at import time: wrong compression settings, excessive resolution, extra accompanying data, and wrong format choices. Mismatched grouping and duplication between bundles are determined by relationships with other assets, so they need a pre-build check. Duplication in particular is invisible. Shared assets not registered in Addressables are duplicated in each bundle that references them, so just two Prefabs referencing a 4 MB texture add up to 10 MB, and registering it in a dedicated group brings this down to 6 MB.
(Part 3, Chapter 2, "Asset Bloat in the Live Operation Phase and Investigation with Project Auditor")
There is also room to cut on the code side. Raising Managed Stripping Level from Minimal to High reduced managed assemblies by about 6.7%, even in a simple scene with only one shutdown-processing script.
(Part 3, Chapter 4, "Unity Managed Code Stripping Practical Guide")
On top of that, record as a design which assets are needed and until when. Centralizing the entry point for loading and release in a foundation layer and deciding the lifetime classification together with the AssetBundle granularity avoids assets with different lifetimes being mixed in the same bundle.
(Part 3, Chapter 1, "Lifetime Management of AssetBundles")
Memory
On iOS, enabling a single Xcode setting can sometimes raise the memory limit applied to the app. In the physical-device observations provided, Increased Memory Limit added about 240 MB of headroom on a 4 GB device and about 1 GB on a 6 GB device. On a 3 GB device, however, there was no difference between enabled and disabled. If allocation fails even though footprint has headroom, Extended Virtual Addressing, which widens the virtual address space, is a candidate.
(Part 3, Chapter 6, "iOS Memory Limits and Virtual Address Space")
To reduce the resident amount itself, first suspect leaked releases of loaded assets.
(Part 3, Chapter 1, "Lifetime Management of AssetBundles")
In asynchronous processing, a missing Dispose of CancellationTokenSource leaves references from the linked source, which shows up as unneeded objects not being released.
(Part 2, Chapter 5, "UniTask and Lifetime Management of Cancellation")
Rendering memory is determined by structure. When 16 animated objects are displayed, the increase in GPU memory is +411.8 MB with the FBX method and +38.2 MB with the Skin method, while the VAT method barely increased it.
(Part 2, Chapter 3, "Reducing Bone Animation Load with VAT")
Duplicating materials also pushes memory up. Giving each of 10,000 Renderers its own material added 15.79 MB, but passing values with RSUV needed only 1.66 KB.
(Part 1, Chapter 5, "Graphics Optimization with Renderer Shader User Value")
Making attachments that are neither loaded nor stored memoryless means they need no backing storage in main memory.
(Part 1, Chapter 1, "Unity 6 Render Graph Tile Memory Optimization")
In build settings, Managed Code Stripping keeps unused code from being loaded into memory in the first place.
(Part 3, Chapter 4, "Unity Managed Code Stripping Practical Guide")
CPU
When showing many characters, how the Transform hierarchy is handled matters. Flattening the hierarchy with Optimize Game Objects reduced MeshSkinning.Update on the main thread from 6.23 ms to about 1.5 ms in a 300-character setup, and the skinning matrix calculation, 36.6 ms in total across all threads, disappeared completely. Manual updates of a Playable Graph are parallelized only per graph, so combining 600 characters into one graph brings 8.396 ms down to 4.500 ms. Moving IK to an Animation Job instead of solving it on the main thread brought 9.094 ms down to 2.795 ms for 300 characters, each solving 64 times. What works is not Burst but moving the execution thread.
Update distant characters only once every N frames. Rather than calling Animator.Update() individually, it is cheaper to return to Unity's batch update by toggling Animator.enabled or by using manual graphs per phase, and updating 600 characters once every 2 frames brought 5.037 ms down to 3.082 ms. If the characters updated are staggered from frame to frame, even an update once every 4 frames keeps p95 within 2.707 ms, down from 9.470 ms, with no spikes.
(Part 2, Chapter 1, "Tuning Unity 3D Character Animation")
With VAT, which replaces the bone updates themselves with precomputation, the CPU main thread with 16 characters displayed went from 154.3 ms to 12.6 ms. Instancing reduced draw commands from about 210,000 per frame to 99, and the 76.17 ms of SRPBatcher.Flush nearly disappeared.
(Part 2, Chapter 3, "Reducing Bone Animation Load with VAT")
Initialization of Animators returned from the pool should also be considered as part of this design.
(Part 2, Chapter 2, "Safely Pooling Animators with ResetControllerState")
A single large spike is investigated differently. When a large number of seconds such as ParticleSystem.Simulate(20f, false, false) is passed to a ParticleSystem with the Noise module enabled, NoiseJob was called about 2,000 times and a spike of about 50 ms occurred.
(Part 2, Chapter 4, "Simulating a Long Duration in ParticleSystem Causes a Huge Spike")
The registration cost of rendering is also CPU load. Combining a chain of passes that cannot be merged into a single UnsafePass reduces a fixed cost of about 1.8 µs per RasterRenderPass. In a ping-pong Blur with 100 passes, 1080.7 µs became 898.5 µs.
(Part 1, Chapter 2, "When to Use UnsafePass in Render Graph")
For drawing in large numbers, RSUV, which passes per-object values without duplicating materials, is effective. In a measurement that changes the parameters of 10,000 spheres every frame on an iPhone 12, per-Renderer materials ran at 8.1 FPS, while RSUV combined with GPU Resident Drawer held 60.0 FPS.
(Part 1, Chapter 5, "Graphics Optimization with Renderer Shader User Value")
For UI, changing one element in uGUI rebuilds the mesh of the entire Canvas, whereas UI Toolkit updates only the parts that changed.
(Part 2, Chapter 6, "Choosing Between UI Systems: IMGUI / uGUI / UI Toolkit")
LTO is a measure that affects the C# code as a whole. On Android, simply adding -flto=thin to the Release build shortened direct calls in the benchmark by 21.8%, well above the 5.9% obtained by switching to Master (-O2). In the steady-state screen of an actual title, UnityMain was shortened by 3.21%.
(Part 3, Chapter 5, "Unity LTO Settings and Performance Comparison on Android and iOS")
GPU
On mobile, memory bandwidth becomes the bottleneck before GPU computing performance. Storing 1080p RGBA8 once and loading it in the next pass alone consumes about 16 MB per round trip, or about 950 MB/s at 60 FPS. The four means of reducing this are explicit load/store actions, pass merging, framebuffer fetch, and memoryless, and all of them require correctly conveying resource usage to Render Graph.
For example, for a pass that always overwrites every pixel, simply declaring it with AccessFlags.WriteAll eliminates a load of about 8 MB/frame at 1080p. Reading the deferred G-Buffer with framebuffer fetch reduces bandwidth by about 24 MB/frame, or about 1.4 GB/s at 60 FPS, leaving only the stores for three buffers. Using Resolve instead of Store for MSAA resolves on tile memory and lets the 4-sample buffer be memoryless.
(Part 1, Chapter 1, "Unity 6 Render Graph Tile Memory Optimization")
The fullscreen Blit that runs once at the end is also a cost that cannot be ignored at high resolutions. Injecting a custom pass at or after AfterRenderingPostProcessing almost always adds URP's FinalBlitPass, but from Unity 6.3 you can call SwitchActiveTexturesToBackbuffer() in the final pass of the last camera to output directly to the BackBuffer and omit it. In the custom FXAA example, the Blit that required two passes in Unity 6.0 became one, and the intermediate texture became unnecessary.
(Part 1, Chapter 3, "How to Omit URP's FinalBlitPass")
Within shaders, transcendental functions stand out. sin can be replaced with a parabolic approximation using only multiplications and abs(), which reduced GPU time by about 2.5 ms on iPhone X and about 1.3 ms on Galaxy S9 when executed 10 times. The tan approximation brought GPU time down to 80% (iPhone 15 Pro) or 50% (iPhone 14) of the original when executed 10 times. However, while the number of executions is small, the overhead from register pressure is noticeable.
(Part 1, Chapter 4, "Mobile Shader Optimization: Measuring and Reducing the Cost of Transcendental Functions")
Stutter at first draw is caused by compilation on the GPU side. On Metal and Vulkan, a single PSO creation can take tens of milliseconds, and GraphicsStateCollection lets you complete it at any timing. Specifying the number of items per frame with WarmUpProgressively() also avoids spikes from the warmup itself. If stutter remains after adoption, suspect missing variants caused by Shader Stripping or mismatched metadata. On iOS, put shaders in a single bundle to prevent them from being loaded twice, and for shaders that use SubPass, draw them once on the loading screen to create the PSO in advance.
(Part 1, Chapter 6, "Shader Warmup with GraphicsStateCollection")
If that is still not enough, switch the rendering settings themselves according to the device. Identify the device with deviceModel, graphicsDeviceName, and systemMemorySize, then either switch the Quality Level or directly operate on RenderPipelineAsset's renderScale and shadow cascade count. If you also provide switches in your own RendererFeature, such as lowering the format or resolution of temporary textures, reducing the number of Blits, or replacing shaders with simpler ones, you can adjust load with the same mechanism.
(Part 3, Chapter 3, "Switching Rendering Settings Per Device")