Chapter 1. iOS Built-in Performance Measurement Features for Unity
1.1. Introduction
Unity provides measurement features such as the Unity Profiler, but for iOS apps you can also use the performance measurement features built into the OS.
These Apple-provided features can be used without depending on Unity's Development Build flag. For example, you can get a rough view of the load before measurement code is integrated, or in a configuration close to a release build with debug features disabled, and you can receive only the trace results from a tester's device. After this rough assessment narrows down the bottleneck candidates to some extent, you can switch to a build with Development Build enabled and investigate in detail with the Unity Profiler or Instruments.
This article introduces the following two features from those that iOS provides built in, and also explains the new features added in macOS 27 / iOS 27.
- Metal Performance HUD
- Performance Trace
We have also published "MetalPerfKit-Unity" *1, an OSS sample repository that makes these features usable from Unity. See it as well for implementation details.
Note: In the following explanation, the term iOS is used throughout, and it includes iPadOS unless otherwise stated.
1.1.1. Test Environment
The behavior described in this article was verified in the following environment.
- Unity 6000.0.81f1
- Xcode 26.6 / 27.0 beta
- iOS 26.6 / 27.0 beta
- macOS 27.0 beta
Note: At the time of writing, iOS 27, macOS 27, Xcode 27, and the StateReporter API described later are in beta. This article reflects information as of August 2026, and APIs, commands, settings screens, and behavior may change before the official release.
1.2. Metal Performance HUD
The Metal Performance HUD is a tool that overlays performance information of an application that uses Metal on the screen in real time, or outputs it as a log. Apple's documentation *2 describes it as a feature for quickly grasping the current state and finding the range to capture in detail with Xcode or Instruments.
This feature itself existed before Metal 4 (the iOS 16 generation), but it was significantly enhanced along with Metal 4 (the iOS 26 generation) announced at WWDC 2025. Figure 1.1 and Figure 1.2 show the difference in display before and after Metal 4.
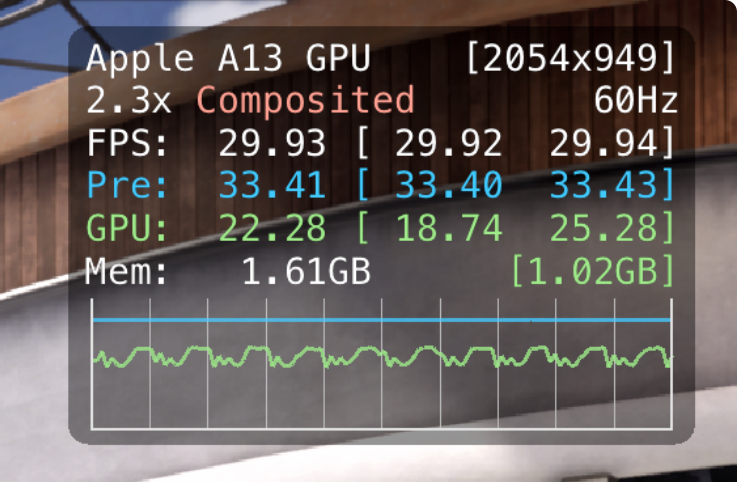
Figure 1.1: Metal Performance HUD before Metal 4
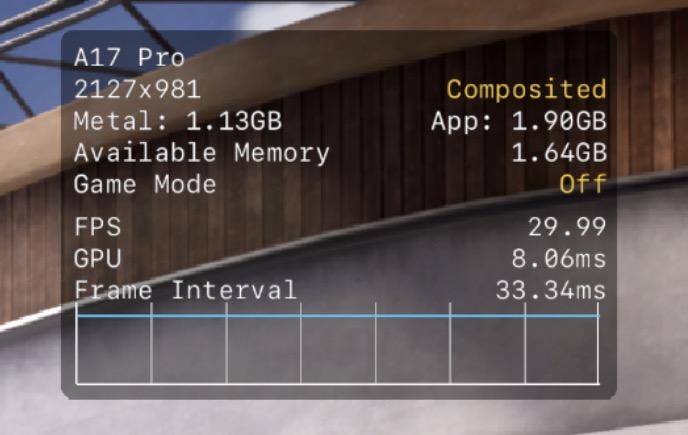
Figure 1.2: Metal Performance HUD in Metal 4 and later
The main enhancements since Metal 4 include more measurement items, customization of display position, opacity, and scale, and more items that can be controlled dynamically from the API.
Figure 1.3 shows an example with the main metrics displayed.
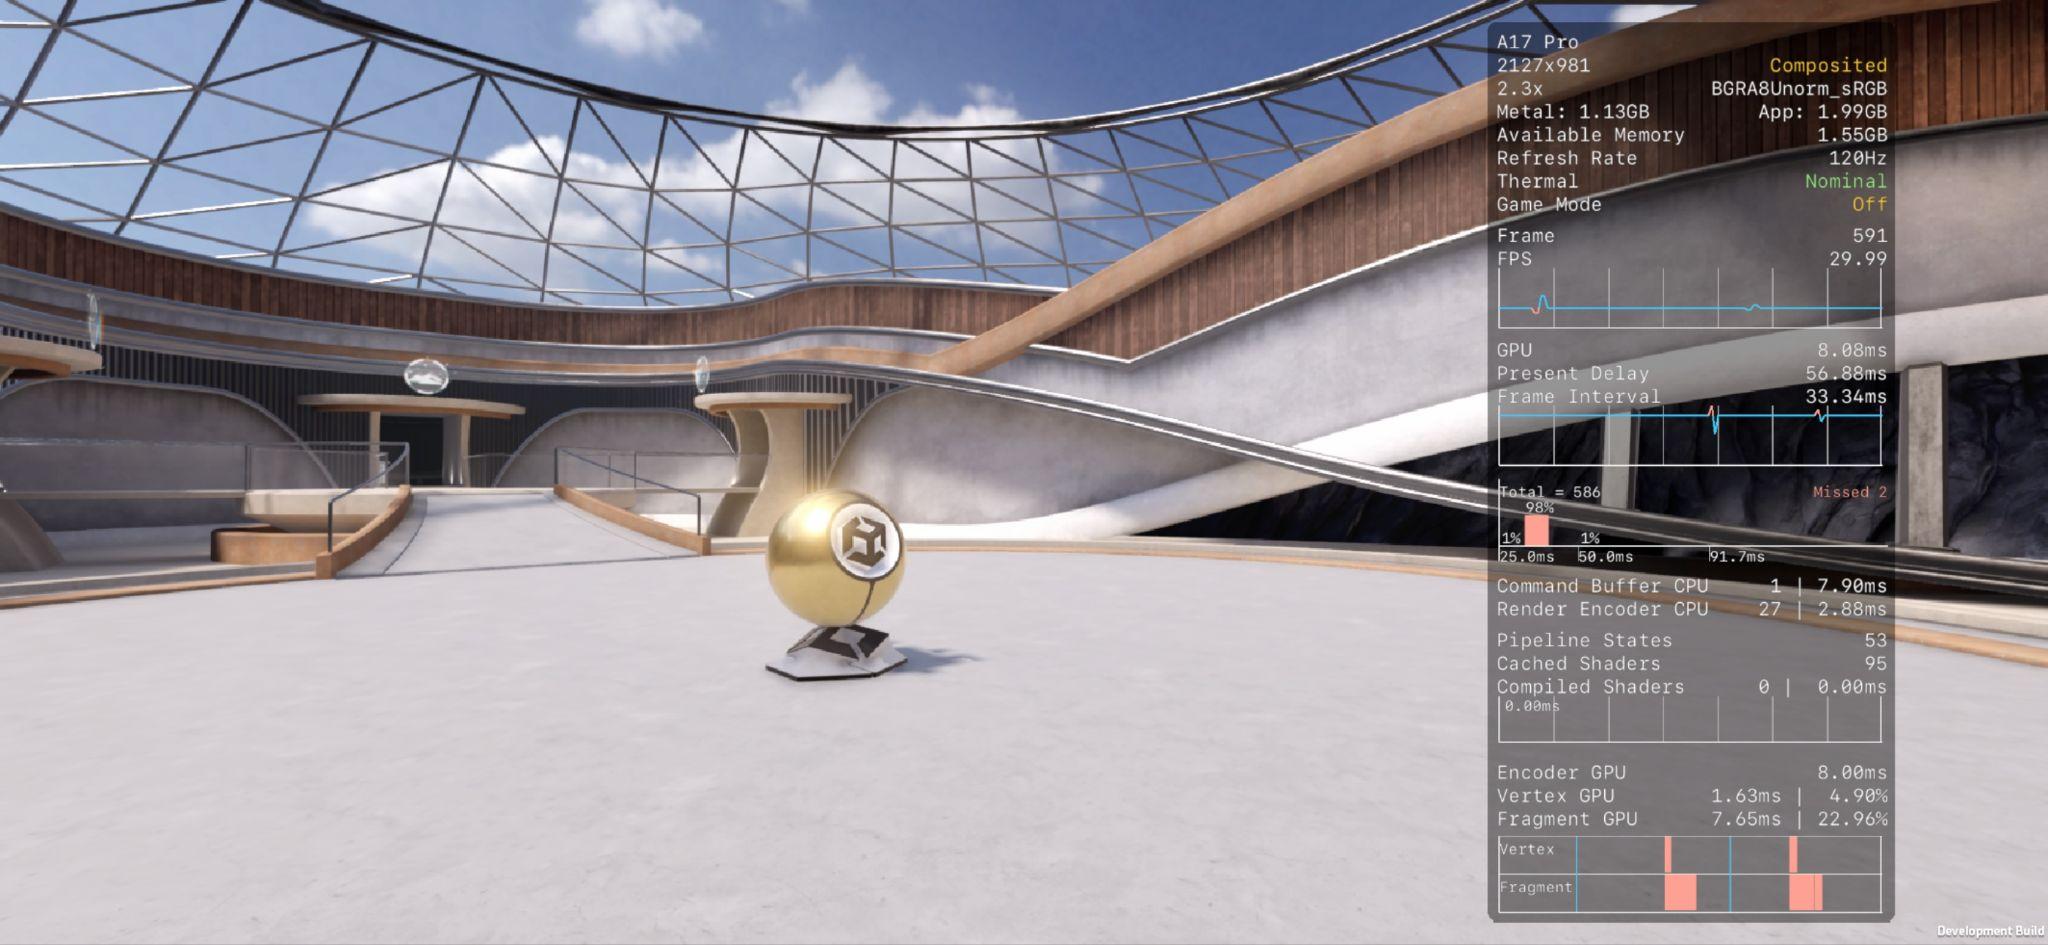
Figure 1.3: Example with the main metrics displayed
For details on each metric, see the official documentation "Understanding the Metal Performance HUD metrics" *3.
The author has also published an article *4 about the Metal Performance HUD and the technical doujinshi "UniTips Vol.12" *5. They cover everything from basic usage to techniques for using it with Unity, so refer to them for details.
The following sections are based on Metal 4 (the iOS 26 generation).
1.2.1. Opening the HUD
There are several ways to display the HUD. This section explains two: "opening it from the Settings app" and "controlling its display through the API."
Opening from the Settings App
You can enable it from the Settings app on the iOS device. The steps are as follows.
Note: As a prerequisite, the Developer menu must be displayed. Depending on the OS version, the menu labels may differ.
- Open the iOS Settings app
- Open the
Developermenu and openMetal HUDwithin it (see Figure 1.4)
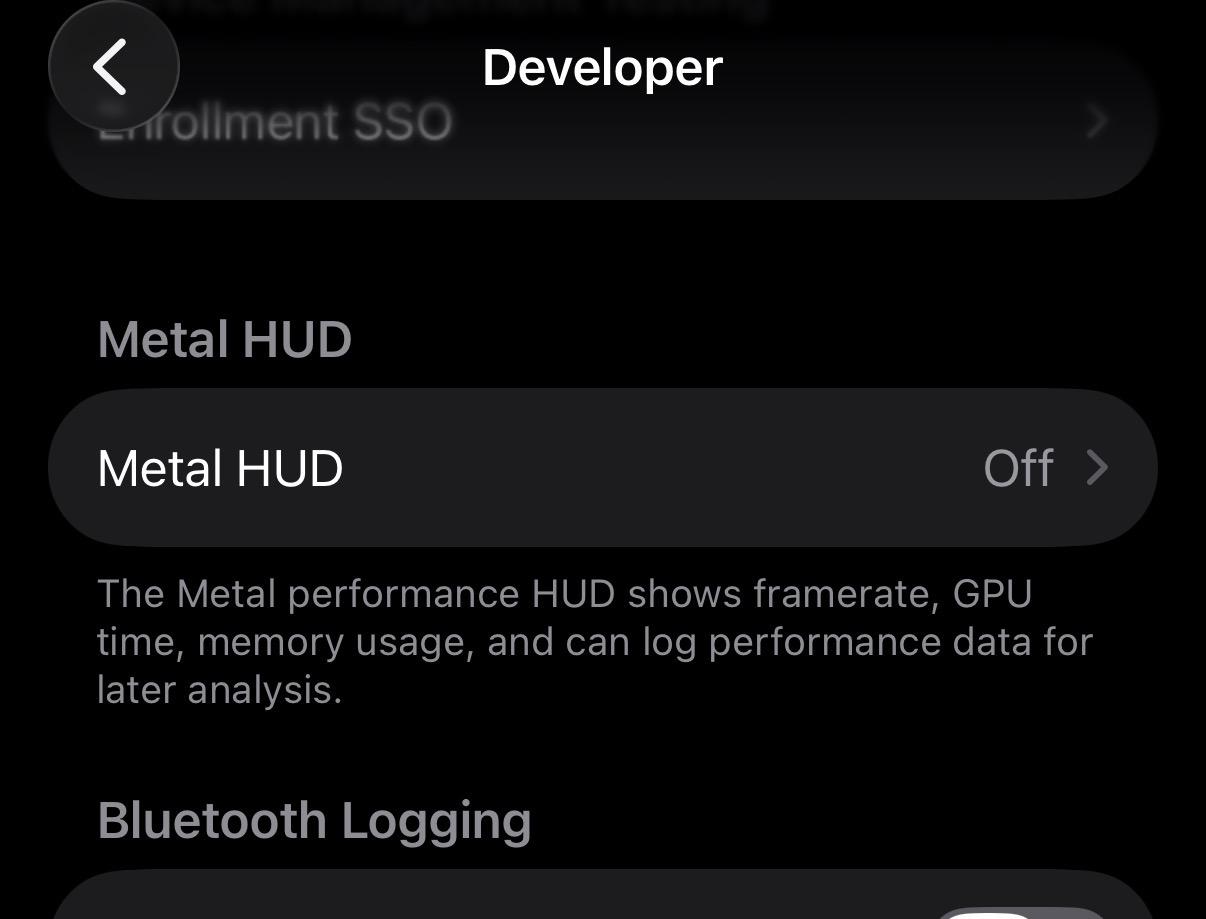
Figure 1.4: Opening Metal HUD from the Developer menu
When you open Metal HUD, the Figure 1.5 screen appears. Enable Show Metal Performance HUD there and restart the target app to display the HUD.
On this screen you can also switch the displayed metrics and change the opacity, scale, and display position. If you enable Log Metal Performance in the same section, performance information is output as a log at regular intervals. Details are explained in "About the Log Feature" later.
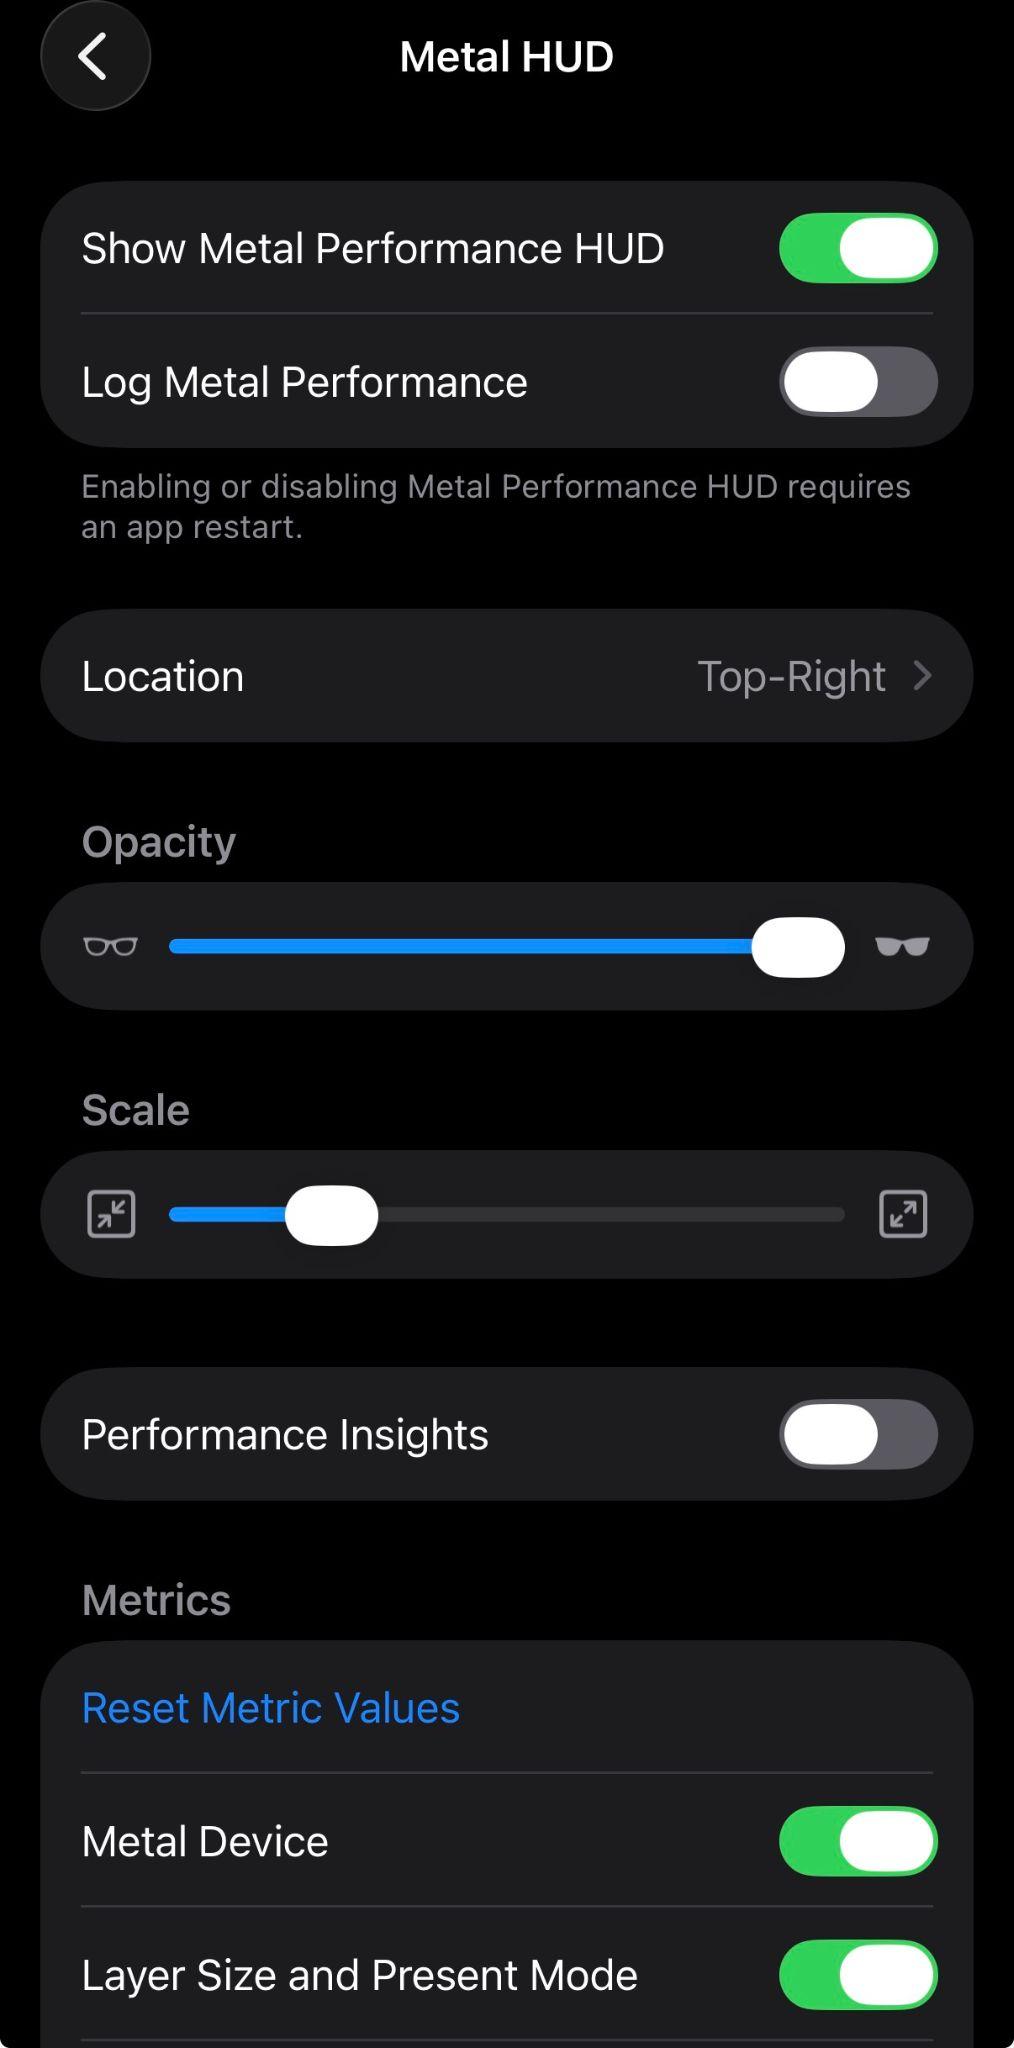
Figure 1.5: Metal HUD settings screen
Controlling Display with the API
To control the HUD display dynamically while the app is running, pass a setting value to the developerHUDProperties property of the CAMetalLayer class. List 1.1 enables the HUD and log output and places the HUD at the top left.
List 1.1: Controlling HUD display with developerHUDProperties
1 2 3 4 5 6 7 8 | myMetalLayer.developerHUDProperties = [ "mode": "default", // HUD ON/OFF "logging": "default", // Log feature ON/OFF "positionX": 0, // Display position (X coordinate in pixels) "positionY": 0, // Display position (Y coordinate in pixels) ] |
To hide the HUD, set disabled to mode. Previously, this property could only control the HUD and log feature ON/OFF and could not adjust the position, but since Metal 4, you can specify the position in pixels with positionX / positionY.
You can also pass environment variable keys supported by the HUD in this Dictionary. For example, passing MTL_HUD_OPACITY and MTL_HUD_SCALE adjusts the opacity and scale in the range 0.0 to 1.0 (List 1.2).
List 1.2: Adjusting opacity and scale with environment variable keys
1 2 3 4 5 6 7 | myMetalLayer.developerHUDProperties = [ ..., "MTL_HUD_OPACITY": opacity, // Opacity (0.0 to 1.0) "MTL_HUD_SCALE": scale, // Scale (0.0 to 1.0) ] |
Many other items can also be configured. For details, see the official documentation "Customizing the Metal Performance HUD" *6.
To call this from Unity, obtain the CAMetalLayer used for rendering in an iOS native plugin and call it from C# through P/Invoke. CAMetalLayer can be obtained via UnityFramework as in List 1.3.
List 1.3: Obtaining CAMetalLayer via UnityFramework
1 2 3 4 5 6 7 8 9 10 | private func getMetalLayer() -> CAMetalLayer? { guard let instance = UnityFramework.getInstance(), let rootView = instance.appController().rootView, let metalLayer = rootView.layer as? CAMetalLayer else { return nil } return metalLayer } |
MetalPerfKit-Unity exposes these implementations as the PerformanceHUDSwitcher class, which can be called from C# as in List 1.4. Whereas the native API specifies the position in pixels, PerformanceHUDSwitcher accepts coordinates as relative positions from 0.0 to 1.0 so that it works independently of resolution, and internally converts them into pixel coordinates according to the size of the drawing area.
List 1.4: Example call to PerformanceHUDSwitcher
1 2 3 4 5 | // Display the HUD at the top right of the screen (x=1.0, y=0.0) // (Coordinates are specified as relative positions from 0.0 to 1.0) PerformanceHUDSwitcher.SetPerformanceHUDVisible(true, 1.0f, 0.0f); |
For a complete implementation example, see the MetalPerfKit-Unity source code.
1.2.2. About the Log Feature
If you enable the Log Metal Performance described earlier or the logging of the API, performance information is output as a log at 1-second intervals while the app is running. The log is output in the List 1.5 format starting with metal-HUD:, and you can view it in the Xcode console or in macOS Console.app.
List 1.5: Output format of the metal-HUD log
1 2 3 | metal-HUD: <first-frame-number-integer>,<graphics-memory-usage-float>,<process-memory-usage-float>,<first-frame-present-interval-float>,<first-frame-gpu-time-float>,...<last-frame-present-interval-float>,<last-frame-gpu-time-float> |
From the beginning, the log records the frame number at which sampling started, the graphics memory usage, and the memory usage of the whole process. After that, pairs of Frame Present Interval and GPU Time for each sampled frame are recorded repeatedly. Figure 1.6 shows an actual output example.
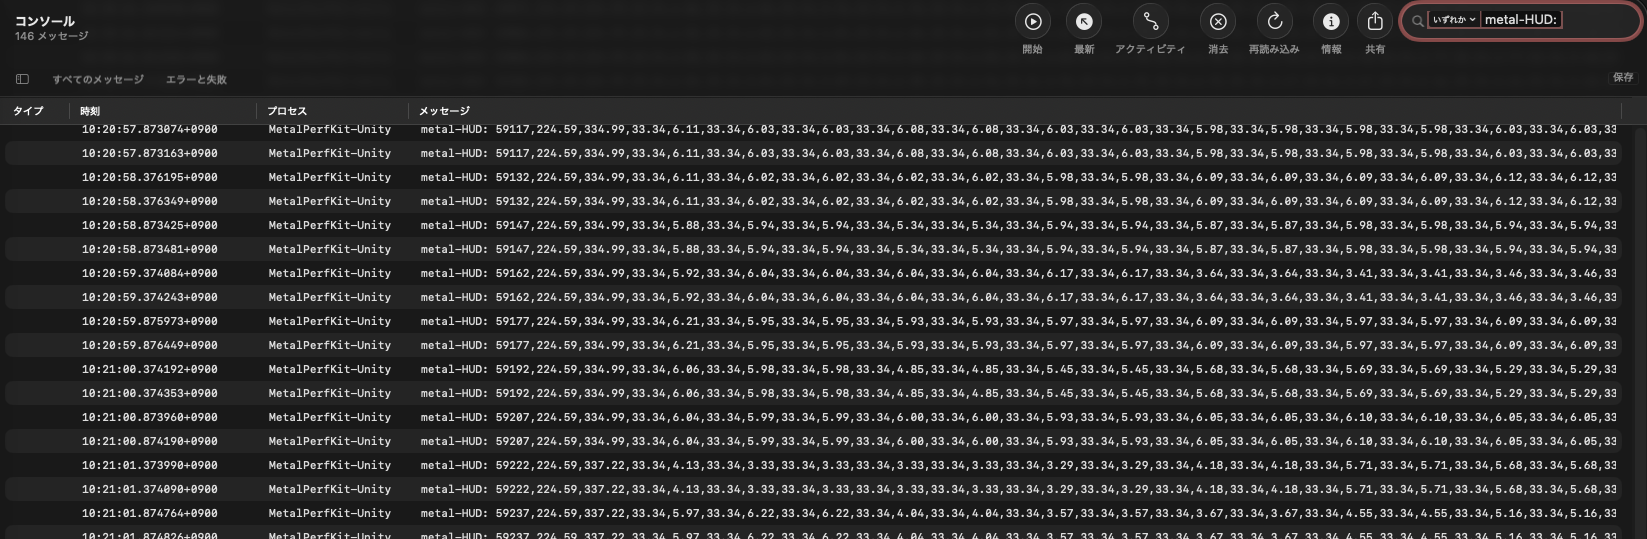
Figure 1.6: Log output example of the Metal Performance HUD
If you aggregate the data as comma-separated values, you can later analyze irregular frame intervals, GPU Time, and changes in memory usage. As long as these logs remain in Unified Logging, you can also implement something like "retrieve the logs for the past N seconds and save them to a file" using the OSLogStore API. MetalPerfKit-Unity provides this feature as the PerformanceLogger class (List 1.6).
List 1.6: Retrieving and saving logs with PerformanceLogger
1 2 3 4 | // Retrieve the logs for the past 60 seconds and save them to a file PerformanceLogger.FetchPerformanceLogs(60, FileUtility.GenerateFetchLoggingFilePath()); |
1.3. Performance Trace
Performance Trace is a feature added in iOS 26 that can collect performance data on an iOS device alone, without connecting to a Mac. The collected trace files can be transferred to a Mac and analyzed with Instruments or the metalperftrace command described later.
Because everything is completed on the device itself, you can record situations that are hard to reproduce while connected to a Mac, such as long play sessions. You can also have someone else, such as a tester, share a trace file collected on their device and analyze it locally.
Among these, this chapter mainly introduces Lookback Collection, which was explained along with its enhancements at WWDC 2026.
1.3.1. Usage
Performance Trace must be enabled from the Developer menu. The steps are as follows.
- Open the iOS Settings app
- Open the
Developermenu and openPerformance Tracewithin it - Enable
Enable Performance Trace(switching between enabled and disabled requires restarting the device) - Select any
Tracing Mode(details later)
Figure 1.7 and Figure 1.8 show Performance Trace in the Developer menu and its settings screen, respectively.
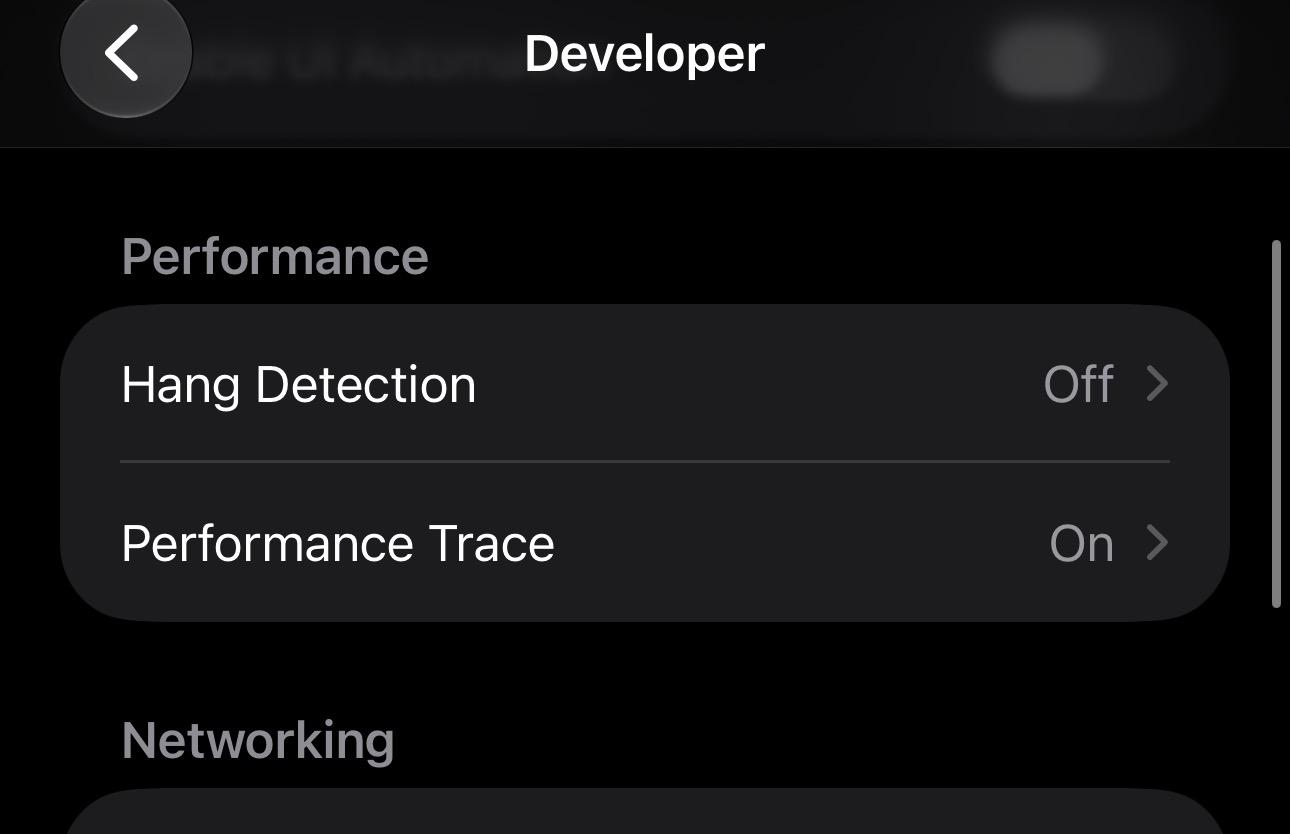
Figure 1.7: Performance Trace in the Developer menu
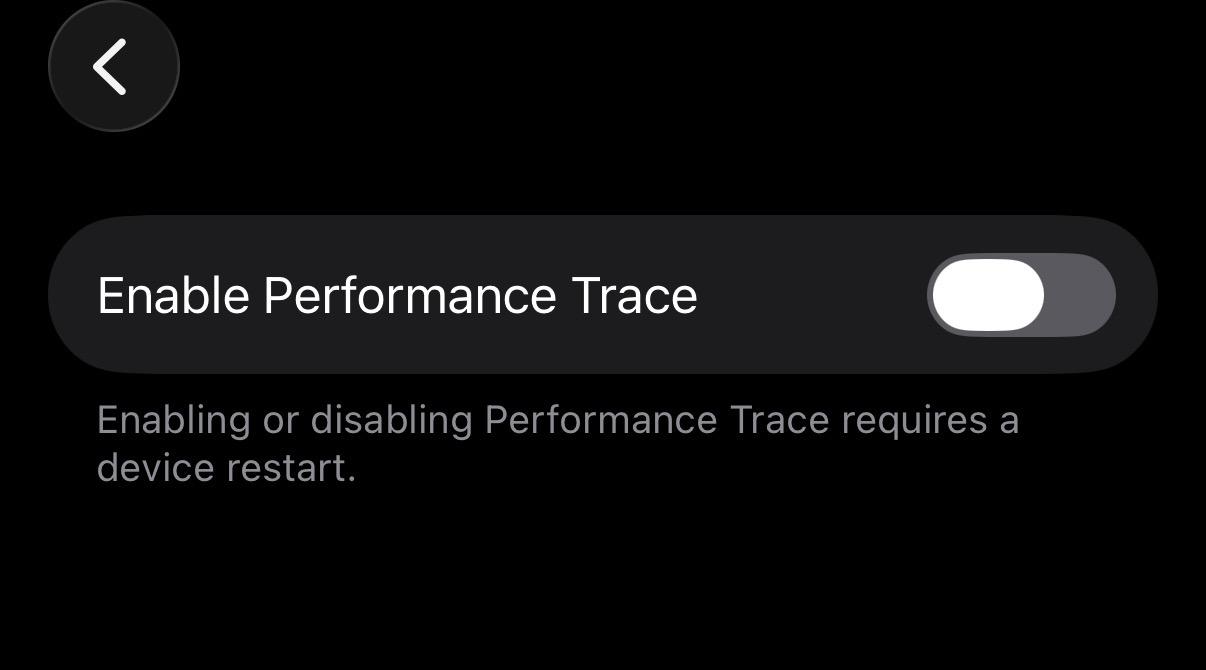
Figure 1.8: Enable Performance Trace settings screen
Once it is enabled, add Performance Trace to Control Center so that you can start and stop traces and collect trace data. Open Control Center and add it from the Developer section. Figure 1.9 and Figure 1.10 show the steps and the state after adding it.
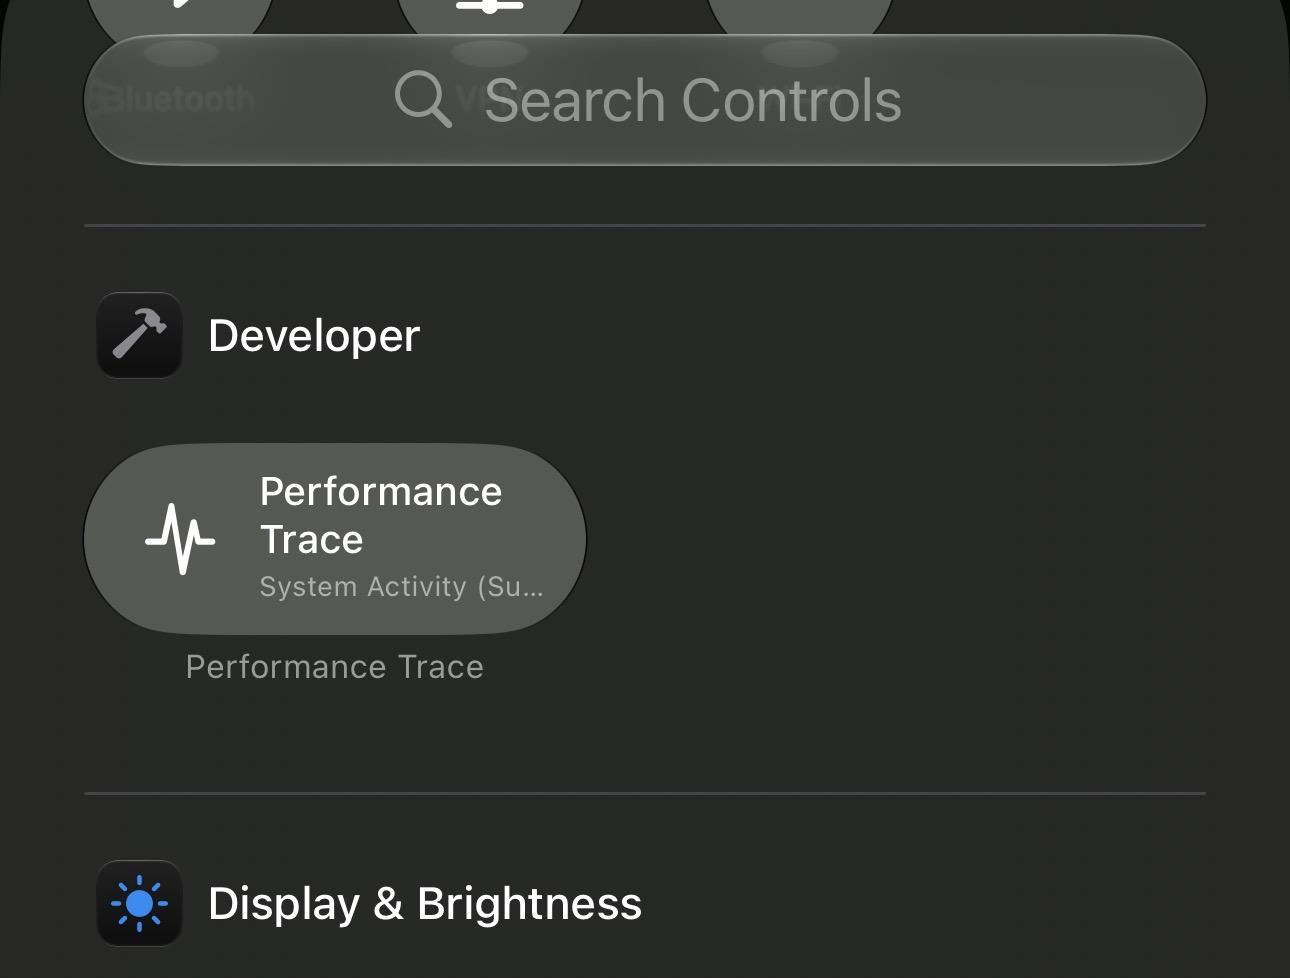
Figure 1.9: Adding Performance Trace to Control Center
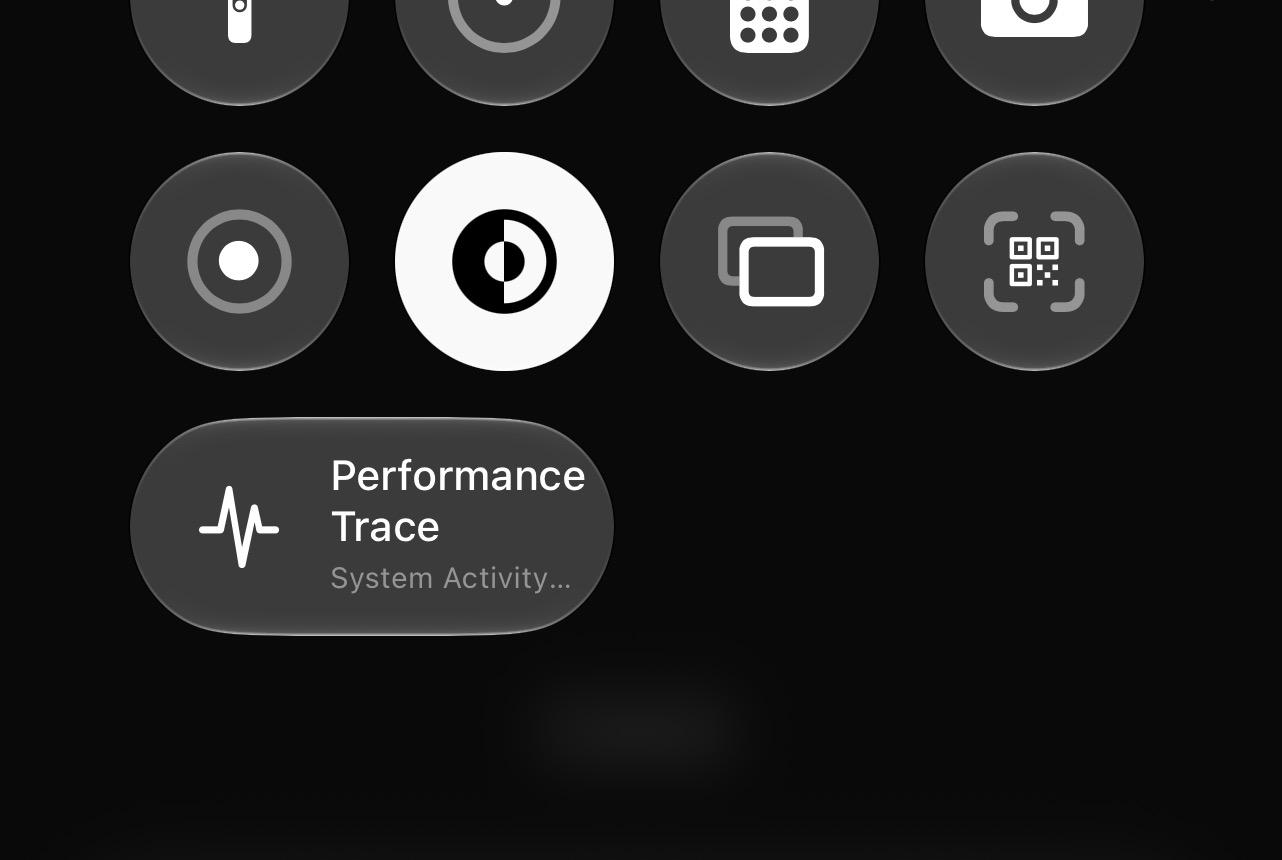
Figure 1.10: State after adding the Performance Trace control
1.3.2. About Tracing Mode
Tracing Mode has the four kinds shown in Table 1.1 (System Activity has two kinds, Summary and Detailed), and you can also switch between them by long-pressing the Performance Trace control in Control Center.
Table 1.1: Kinds of Tracing Mode
| Mode | Overview |
|---|---|
| Power Profiler | Records the impact on power consumption |
| System Activity (Summary / Detailed) | Records system activity |
| Lookback Collection | Collects, retroactively, the data that the system continuously records |
For Power Profiler and System Activity, tap the Performance Trace control in Control Center to start recording and tap it again to stop. Lookback Collection, on the other hand, requires no recording operation and collects data going back in time from the moment you tap. Details are described later.
Collected trace files are listed in Available Trace Files on the Performance Trace screen, and you can transfer them to a Mac or other developers with AirDrop or similar via the share button. Extracting a shared archive gives you a .atrc file that can be opened in Instruments. Trace files are deleted automatically when the device's remaining storage becomes low, and can also be deleted manually by swiping.
Additional notes on each mode are as follows.
Power Profiler
Power Profiler is a mode that measures the impact (Power Impact) that the app's use of subsystems such as CPU, GPU, display, and network has on the device's power consumption. This article omits the details, but they are explained in the official documentation "Measuring your app’s power use with Power Profiler" *7 and the WWDC 2025 session "Profile and optimize power usage in your app" *8.
System Activity
System Activity is a trace mode that comes in two kinds, "Summary" and "Detailed." As far as the author could confirm, at the time of writing (August 2026), Apple's documentation and WWDC sessions contain no explanation of the detailed specifications of System Activity or of the difference between Summary and Detailed. Therefore, this article does not go into the details of each mode and introduces only the information confirmed in actual traces.
For reference, List 1.7 shows the result of recording a System Activity (Summary) trace on a device running iOS 27 and analyzing it with the metalperftrace command described later.
List 1.7: Analysis result of a System Activity (Summary) trace
1 2 3 4 5 6 7 8 9 10 11 12 13 14 15 16 17 18 |
$ metalperftrace overview system_activity_summary_ios27.atrc
[MetalPerfKit-Unity pid:1974]
   Mem: 799.0 MiB (799.0 Peak, 616.8 Metal, 2577.0 Headroom)
   Total CPU Time: 12.679s (20.47% Sys, 79.53% User)
   Instructions: 43.33B (60.88% P, 39.12% E)
   Cycles: 21.04B (38.97% P, 61.03% E)
   Disk Reads / Writes: 9.13 / 0.08 MiB (Logical Write 0.07)
   [States]
     com.DefaultCompany.MetalPerfKit-Unity.graphics: 3 transitions, last known state: URP-HighFidelity
     com.DefaultCompany.MetalPerfKit-Unity.screen: 11 transitions, last known state: Title
 UnityView (UnityDefaultViewController) (1290x2796)  Interval 30.037s  Active 30.037s
   44.5 FPS  1202 Frames  1202 Detached  11 Skipped
   Frame Time           avg:  22.47ms  min:  16.67  max: 420.93  stddev:  30.68  p95:  50.01  p99: 133.36
   CPU Begin-to-Present avg:  17.24ms  min:   1.14  max: 794.63  stddev:  31.76  p95:  31.28  p99: 111.73
   On-GPU Time          avg:  15.50ms  min:   1.81  max: 424.87  stddev:  37.24  p95:  51.17  p99: 134.48
   Next Drawable Wait   avg:  14.53ms  min:   0.00  max: 401.43  stddev:  32.11
|
In this trace, in addition to per-process memory usage, CPU time, and disk I/O, we could see statistics such as FPS, Frame Time, CPU Begin-to-Present, and On-GPU Time per CAMetalLayer. The [States] item records the app's state transitions, but these come from the StateReporter API explained in the next chapter, so details are described later.
Lookback Collection
Lookback Collection is a mode that retroactively collects the performance data that the system continuously records. As far as the author could confirm, Lookback Collection already existed as an option of Tracing Mode as of iOS 26, but it was not explained at WWDC 2025 or in the official documentation. Its capabilities were then enhanced at WWDC 2026, and the session video "Find and fix performance issues in your Metal games" *9, which explains the enhancements, was published.
According to the talk, while a game is running, the system continuously records performance metrics (CPU, GPU, FPS, memory, and so on) and keeps that data for several days. Because Lookback Collection uses this mechanism, it can retrieve data retroactively even for a long play session by a tester. Figure 1.11 shows an overview of this mechanism.
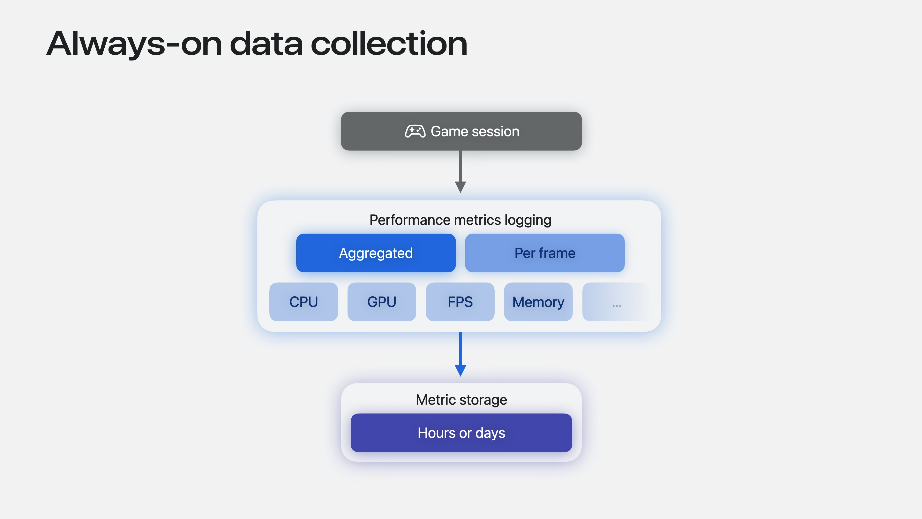
Figure 1.11: Continuous recording of performance metrics by the system (from the WWDC 2026 session)
To use it, play-test as usual and then simply tap the Performance Trace control in Control Center. Collection and processing of a trace going back the configured amount of time from the moment of the tap begins, and when it completes, a notification arrives and the trace is added to Available Trace Files.
Figure 1.12 shows an example in which a Lookback Collection trace covering about 3 hours was collected on a device running iOS 26 and opened in Instruments. The multiple apps (processes) that were running during the period covered are listed, and you can get an overview of the changes in FPS and other metrics for each.
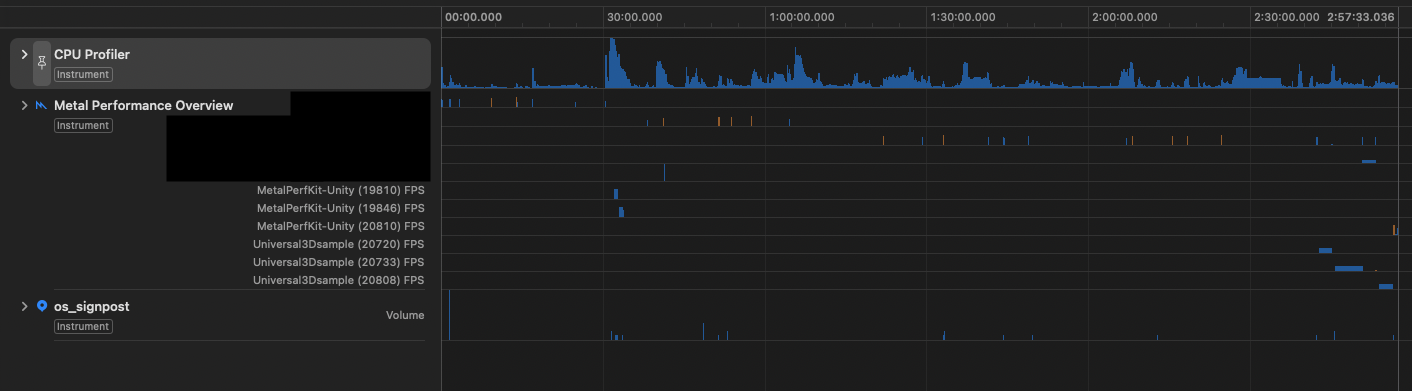
Figure 1.12: Example of a Lookback Collection trace opened in Instruments
Expanding a process further, as in Figure 1.13, you can see how frame metrics such as FPS, GPU Usage %, Frame Interval, and CPU / GPU time change per CAMetalLayer.
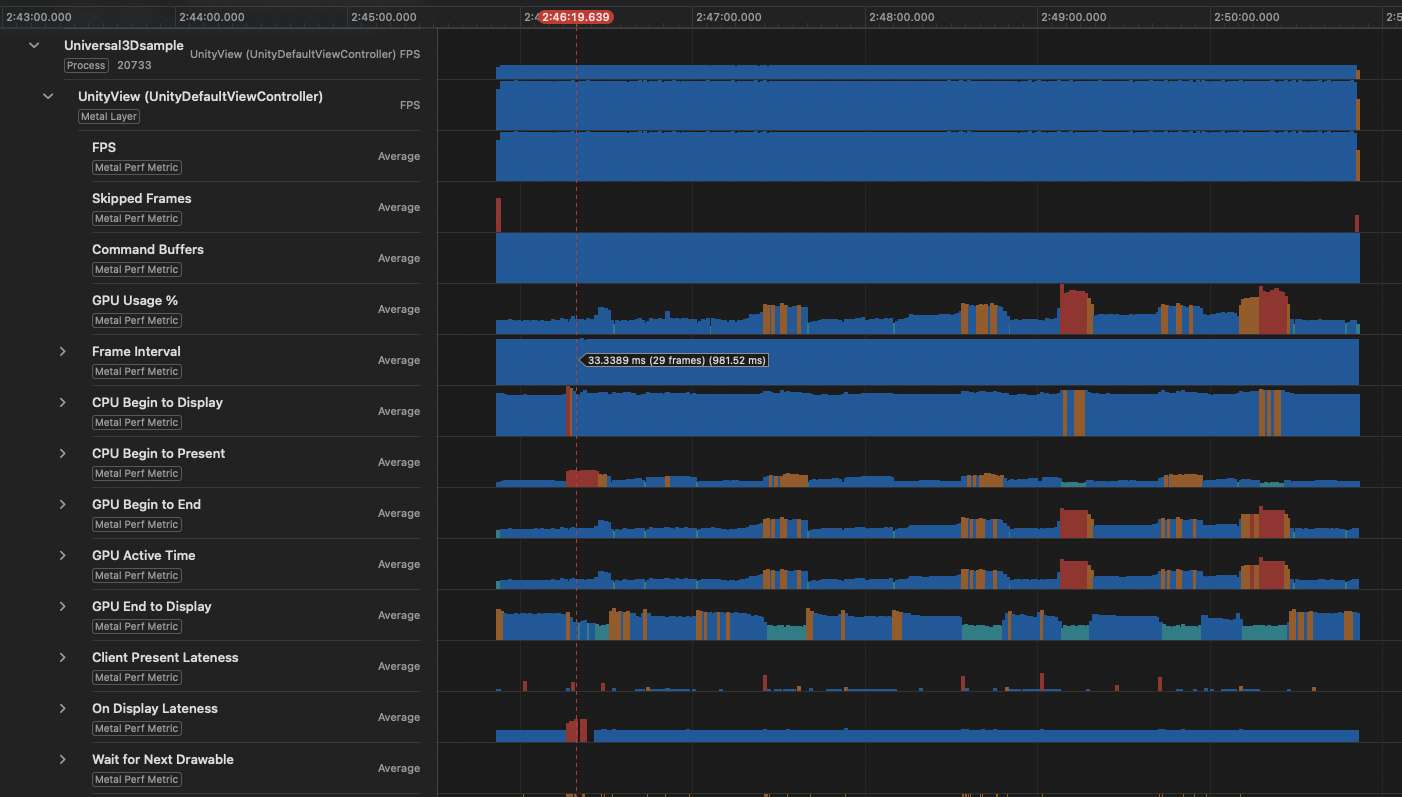
Figure 1.13: Changes in frame metrics per CAMetalLayer
Note: In my iOS 27 environment, Error processing Performance Trace was displayed during aggregation and it did not work correctly. Regarding this issue, even at the official release of iOS / iPadOS 27, the release notes in Control Center -> Known Issues list a known issue (184729556): "Collecting Power Profiler or Lookback traces may not generate a trace." *10
1.4. New Features Added in macOS 27 / iOS 27
As introduced in the previous chapter, the system continuously records and stores Metal performance metrics while a game is running. Built around this mechanism, WWDC 2026 announced the StateReporter API, which attaches app-specific information to traces, and the metalperftrace command, which analyzes traces from the CLI.
1.4.1. StateReporter API
Even if you can identify the time at which the frame rate dropped in the trace data, Metal performance metrics alone do not tell you what the game was doing at that moment. This is because app-specific information, such as which scene of the game is open, how many objects there are, and what the graphics settings are, is not automatically included in Metal performance metrics.
Using the StateReporter API *11 of the StateReporting framework *12 added in iOS 27, you can report the app's state to the system and attach app-specific context to the trace data.
The reported state is used for per-state aggregation in metalperftrace and for displaying Points of Interest in Instruments. Figure 1.14 shows the System Activity trace from the previous chapter opened in Instruments. The reported states appear as a Points of Interest track.
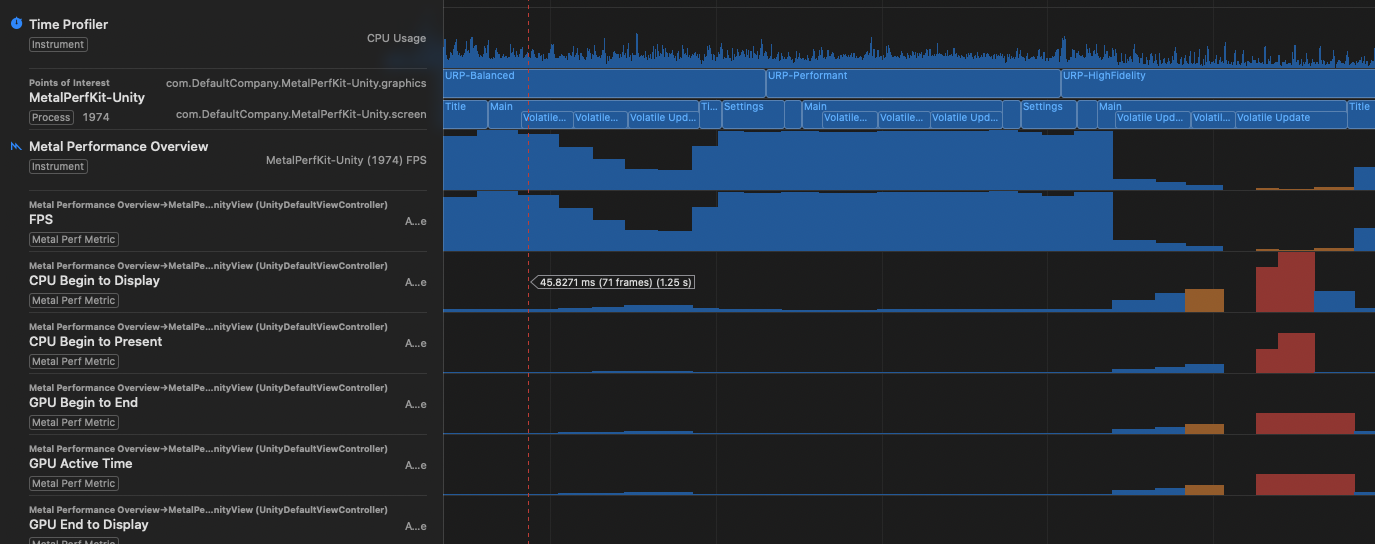
Figure 1.14: Example of reported states displayed as Points of Interest
StateReporter consists of the four elements shown in Table 1.2.
Table 1.2: The four elements of StateReporter
| Element | Overview | Example |
|---|---|---|
| Domain | The functional area to report. A reverse-DNS string; only one state can be active at a time per domain | com.mygame.level |
| Label | A short string indicating the current state | Level 1 |
| Stable metadata | Metadata that does not change for the lifetime of the state. Combined with the Label, it uniquely identifies the state | {id: 1001} |
| Volatile metadata | Volatile metadata that can change within a state. Updating it does not cause a state transition | {health: 20} |
You can define multiple domains. For example, you can report "level progress," "graphics settings," and "network state" as independent domains and analyze them in combination.
In Swift, you use it as in List 1.8.
List 1.8: Example of using StateReporter from Swift
1 2 3 4 5 6 7 8 9 | import StateReporting // Get the Reporter for the domain let reporter = StateReporter.reporter(for: "com.mygame.gameplay") // Report a state transition reporter.reportTransition(to: "Playing") // Pass nil to end the state reporter.reportTransition(to: nil) |
Using It from Unity
Because StateReporting is an API for Swift / Objective-C, a native plugin is required to use it from Unity. MetalPerfKit-Unity provides a class StateReporter that wraps it as a preview feature, which can be used from C# as in List 1.9.
List 1.9: Example of using StateReporter from C#
1 2 3 4 5 6 7 8 9 10 11 12 13 14 15 16 17 18 | using MetalPerfKit; // Get the Reporter for the domain var reporter = StateReporter.ReporterForDomain($"{Application.identifier}.screen"); // Report a state transition (with volatile metadata) reporter.ReportTransitionToStateLabel( "Main", volatileMetadata: new Dictionary<string, StateReporterMetadataValue> { ["CubeCount"] = cubeCount, }); // Keep the state and update only the volatile metadata reporter.ReportVolatileMetadataUpdate( new Dictionary<string, StateReporterMetadataValue> { ["CubeCount"] = cubeCount, }); |
The repository's Assets/_Example/2_MetalPerformanceMetrics also includes a sample that reports screen transitions (Title / Main / Settings) and graphics quality (three URP levels) as independent domains. The [States] in the System Activity trace shown in the previous chapter was recorded with this sample.
1.4.2. metalperftrace
metalperftrace is a CLI tool added in macOS 27 that can analyze trace files and collect performance metrics of macOS apps. The collection feature targets apps running on macOS and is not covered in this article, but you can use this tool to analyze trace files collected on iOS devices.
Analyzing Trace Files
Use the overview subcommand to analyze trace files (List 1.10).
List 1.10: Analyzing a trace file with the overview subcommand
1 2 3 4 |
# Analyze a collected trace file
metalperftrace overview MyGameTrace.atrc
|
The output is as introduced in the previous chapter. If you also pass --include-state-transitions, you can see the details of the state transitions recorded with StateReporter. List 1.11 is an example of analyzing the trace of the sample app described earlier, and it outputs the history of changes to each graphics quality together with the time and percentage spent in each state.
List 1.11: Analysis result including state transition details
1 2 3 4 5 6 7 8 9 10 11 12 13 14 15 16 17 18 19 20 21 22 |
$ metalperftrace overview --include-state-transitions system_activity_summary_ios27.atrc
[MetalPerfKit-Unity pid:1974]
   ...
   [States]
     com.DefaultCompany.MetalPerfKit-Unity.graphics
       URP-Balanced  (32.75%, 9.904s)
         (2026-08-16T14:22:33.025Z → 2026-08-16T14:22:42.930Z)
       URP-Performant  (29.43%, 8.900s)
         ...
       URP-HighFidelity  (37.82%, 11.437s)
         ...
     com.DefaultCompany.MetalPerfKit-Unity.screen
       Title  (5.07%, 1.535s)
         ...
       Main  (21.09%, 6.379s)
         ...
       Title  (2.22%, 0.671s)
         ...
       Settings  (6.28%, 1.899s)
         ...
|
Note: The output is partially excerpted and formatted. In practice, the same state is also output repeatedly in chronological order, each with start and end timestamps.
Passing --aggregate also lets you aggregate metrics per state. Specifying --domain com.mygame.graphics narrows the result to a specific domain, and combining it with --state-label "High" narrows it down to a specific state. You can check the correlation between app state and performance, such as "the average FPS drops only when the graphics setting is High," with a single command.
These outputs can also be obtained in JSON format by passing --json. The talk also stated that "structured output can be used for regression tests with scripts and for automatic triage of performance issues by AI agents." Apple's "Metal Developer Tools" page *13 also introduces a workflow combined with agents under the title "Hello, agentic debugging."
[*1] MetalPerfKit-Unity https://github.com/mao-test-h/MetalPerfKit-Unity
[*2] Monitoring your Metal app’s graphics performance https://developer.apple.com/documentation/xcode/monitoring-your-metal-apps-graphics-performance
[*3] Understanding the Metal Performance HUD metrics https://developer.apple.com/documentation/xcode/understanding-metal-performance-hud-metrics
[*4] 【Unity】Measuring GPU load on a mobile app https://qiita.com/mao_/items/3b531d17cacb86036b7f
[*5] UniTips Vol.12 (explained in "Chapter 2: Using the Metal Performance HUD Enhanced Since Metal 4 with Unity") https://techbookfest.org/product/8mHpXz8LJCKAsLxENJKwaz?productVariantID=ewK5GtNTjkz4k8heM4BrxU
[*6] Customizing the Metal Performance HUD https://developer.apple.com/documentation/xcode/customizing-metal-performance-hud
[*7] Measuring your app’s power use with Power Profiler https://developer.apple.com/documentation/xcode/measuring-your-app-s-power-use-with-power-profiler
[*8] WWDC 2025 - Profile and optimize power usage in your app https://developer.apple.com/videos/play/wwdc2025/226/
[*9] WWDC 2026 - Find and fix performance issues in your Metal games https://developer.apple.com/videos/play/wwdc2026/388/
[*10] iOS & iPadOS 27 Release Notes https://developer.apple.com/documentation/ios-ipados-release-notes/ios-ipados-27-release-notes
[*11] StateReporter https://developer.apple.com/documentation/statereporting/statereporter
[*12] Getting started with StateReporting https://developer.apple.com/documentation/StateReporting/getting-started-with-statereporting
[*13] Metal Developer Tools https://developer.apple.com/metal/tools/