Chapter 2. Asset Bloat in the Live Operation Phase and Investigation with Project Auditor
In a project that stays in live operation, the app size and memory usage grow little by little. This chapter covers why bloat recurs even on teams that know the countermeasures, how to stop it, and how to find the assets that keep growing. It does not cover reducing the size of individual assets themselves.
2.1. Why Bloat Progresses in the Live Operation Phase
Bloat accumulates gradually through day-to-day operation: high-resolution banners added for a seasonal event, voice lines and cut-ins for limited-time characters, externally produced materials accepted for a collaboration, and campaign assets that remain after the announcement has ended. Each item may be acceptable on its own, but over successive releases the total becomes significant. Moreover, the more it accumulates, the higher the cost of reviewing it, so cleanup keeps dropping in priority. The cause lies less in technology than in operational rules becoming lax. In the live operation phase, the following four things happen repeatedly.・Standards become outdated: even when devices and requirements change and the standards no longer match reality, nobody rewrites them. Exceptions approved with the claim that this is just for this time pile up.・Checks become lax: as deadlines approach, verification of delivered materials is skipped, and handovers are left incomplete when the person in charge changes.・Temporary workarounds remain: uncompressed textures or individually exported sprites added in a hurry stay in place, and the work to revert them is never done.・Decision criteria are not recorded: because the rationale for settings is not documented, the same criteria cannot be reproduced when the person in charge changes. None of these can be solved by introducing a tool alone.
2.2. Keep Operating the Standards
Decide the target metrics, select the supported devices, and verify in the scene with the highest load. How to create such a convention is covered in Chapter 1 of the previous book, "Unity Performance Tuning Bible". The problem in the operation phase comes after the convention is decided. Standards drift from reality as soon as they are set. Therefore, decide in advance the events that trigger a review, such as a change in supported devices, an update of Unity or the rendering pipeline, or a change in the measurement method. In particular, a change in the measurement method shifts the numbers even for the same asset, so record how to measure together with the standards. Make the numeric values in the standards checked at export, at import, or in the automated build. Decide per item whether to fail or pass the build, and even when it passes, leave the measured values in a place visible to the whole team, such as the build log or a report. A warning shown only on the author's own screen gets overlooked. Fixing an asset that exceeds the standards does not end with correcting a value. If you change compression settings, you must check under the same conditions as production whether the appearance remains acceptable; if you rearrange bundles, you must check that no references have broken. As the previous book warns, redoing work after mass production is a process that includes ordering, quality checks, and debugging. Rather than fixing everything at once, the ideal is to measure at every release and fix the increase each time.
2.3. Classification of Bloat Patterns
Summarizing countermeasures by material type tells you which materials are heavy, but not why they became heavy. If the cause remains, the same bloat recurs. Therefore, this chapter classifies bloat by cause into six patterns that cut across material types.
Table 2.1: Six bloat patterns
| Pattern | What is happening |
|---|---|
| Incorrect compression settings | Import settings are left uncompressed or at defaults, occupying several times the necessary size |
| Excessive resolution | Assets are imported without specifying a maximum resolution, so size grows in proportion to area |
| Unnecessary accompanying data | Unused auxiliary data is left enabled, shipped with the asset, and also held in memory |
| Wrong format choice | A format that does not suit the purpose or platform is chosen, using extra size or being decompressed at runtime and consuming memory |
| Mismatched grouping | The way Sprite Atlases or bundles are grouped does not match the actual unit of use, so unused content is loaded together, such as loading an entire atlas to display a single Sprite |
| Duplication across bundles | Shared assets are referenced without being registered, and are included once for every referencing bundle |
The first four can be determined at asset import time, but the last two are determined by relationships with other assets and so cannot be determined at that point. This difference is why the next section splits the countermeasures into two stages.
2.4. Automatic Application at Import and Pre-Build Inspection
To stop recurrence, apply the correct settings when assets are imported, and then find what slipped through before the build. There are two means of automatic application. If values must vary by condition, use AssetPostprocessor, which lets you insert processing before and after import. If you only need to fix default values per type, a Preset is sufficient. However, applying settings at import alone lets some things slip through. Assets brought in together with their .meta files keep their settings as they are, and the last two patterns in the previous section cannot be determined at this stage. Therefore, at the pre-build or automated build stage, inspect whether any assets that violate the standards have slipped in. If you write limit standards such as the maximum texture resolution or mesh polygon count as tests, the same criteria can be used in both the Editor and the automated build. OSS for this purpose is also available, such as AssetRegulationManager *1. An operation that does not turn such inspection into a mechanism and only writes the standards in a document and announces them leads directly to the two conditions mentioned at the beginning: outdated standards and unrecorded decision criteria. Deciding the rules is a human task, but leave the enforcement to machines.
2.5. How Duplication Across Bundles Occurs
Of the six patterns, duplication across bundles is the hardest to see. This is because the cause lies not in the settings of individual assets but in the reference relationships between assets. Addressables manages assets in groups and packs them into one bundle per group at build time. At this point, assets not registered as Addressable are treated as implicit dependencies and are duplicated into each bundle that references them.
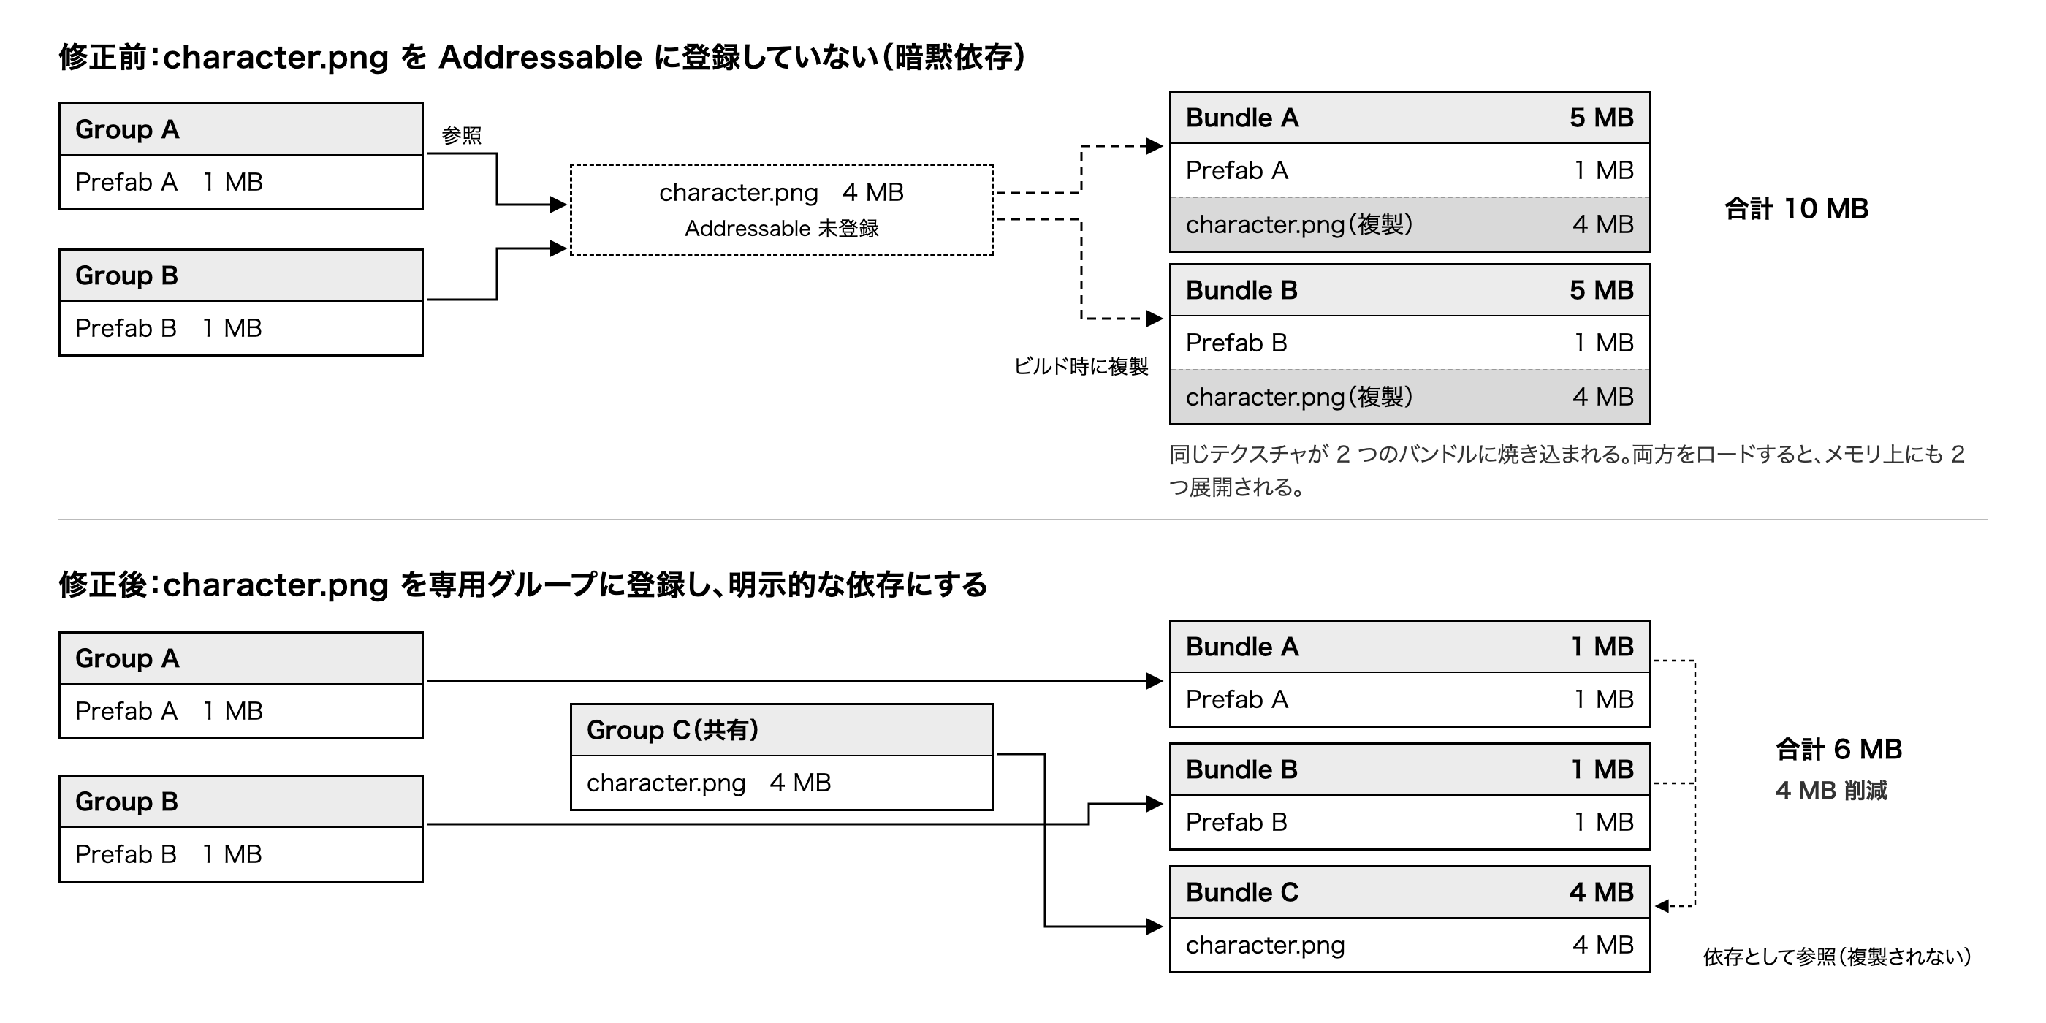
Figure 2.1: Duplication of an unregistered shared asset (top) and the case where it is registered in a dedicated group (bottom)
In the example in the figure, simply having two Prefabs reference a 4MB texture makes the bundle total 10MB. If this texture is registered in a dedicated group and made an explicit dependency, the duplication is eliminated and the total drops to 6MB. As the number of referencing assets grows, the duplicates grow by the same number, and if they are loaded at the same time, the same amount is also expanded in memory, so the impact increases the longer it is left. Note that actual bundles are compressed, so the numbers are a rough guide to illustrate the mechanism. Such duplication cannot be traced by eye, so detect it with a tool. With Addressables, you can use Addressables Analyze *2 (it was temporarily removed in the 2.0 series and restored in 2.3.1). There is also a feature that automatically resolves detected duplicates, but it rewrites the group configuration, so check the build result after applying it.
2.6. Investigating Bloated Assets
Standards and inspection can stop new bloat, but assets that have already accumulated must be found separately. For asset profiling, there are several tools with different purposes.
Table 2.2: Tools for investigating size and memory
| Tool | What it shows |
|---|---|
| Build Report / Editor Log | Breakdown of build size by category |
| Addressables Analyze | Detection and fixing of duplicated bundle dependencies in Addressables |
| Project Auditor | Import settings and static configuration issues across the whole project |
| Memory Profiler | Runtime memory usage and object reference relationships |
Of these, Memory Profiler is covered in Chapter 3, "Profiling Tools," of the previous book. This chapter covers Project Auditor, which the previous book did not introduce.
2.7. Finding Issues with Project Auditor
Project Auditor is a tool that statically analyzes the assets, code, and settings in a project and outputs a list of problem areas. Even at a stage where there has been no time to formalize standards, it lets you grasp what could become a problem. It was an experimental package for a long time, but version 1.0 was released in February 2025 and it became an official release. The screens and items below were confirmed with Unity 6.4 and Rules package 1.0.3.
2.7.1. Installation Differs by Unity Version
Before Unity 6.4, add com.unity.project-auditor from the Package Manager *3. From 6.4 onward it is bundled with the Editor, so adding it is unnecessary *4, but the rules used for judgment have been separated into com.unity.project-auditor-rules, so analysis is not possible unless you install that package (Figure 2.2).
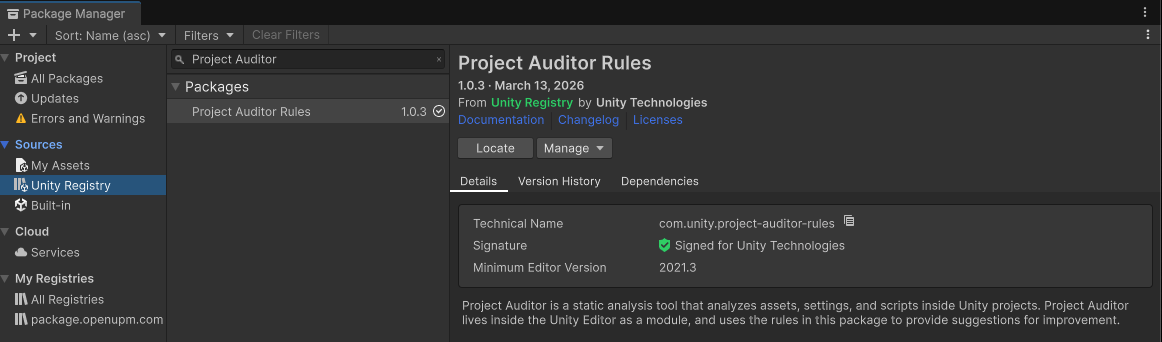
Figure 2.2: The Rules package. The analysis core exists as an Editor module
Because the rules are separated from the core, you can update only the rules without raising the Editor version.
2.7.2. Using the Assets View
When you open Window > Analysis > Project Auditor and run the analysis, the results are divided into the Summary, Code, Assets, Shaders, Project, and Build views (more views may be added depending on the Unity version). The view used for investigating size and memory is the Assets view, which is divided into nine, including Asset Issues, Textures, and Sprite Atlases. The first one to open is Asset Issues (Figure 2.3). Detected problems are grouped by type, and the number found for each is displayed.
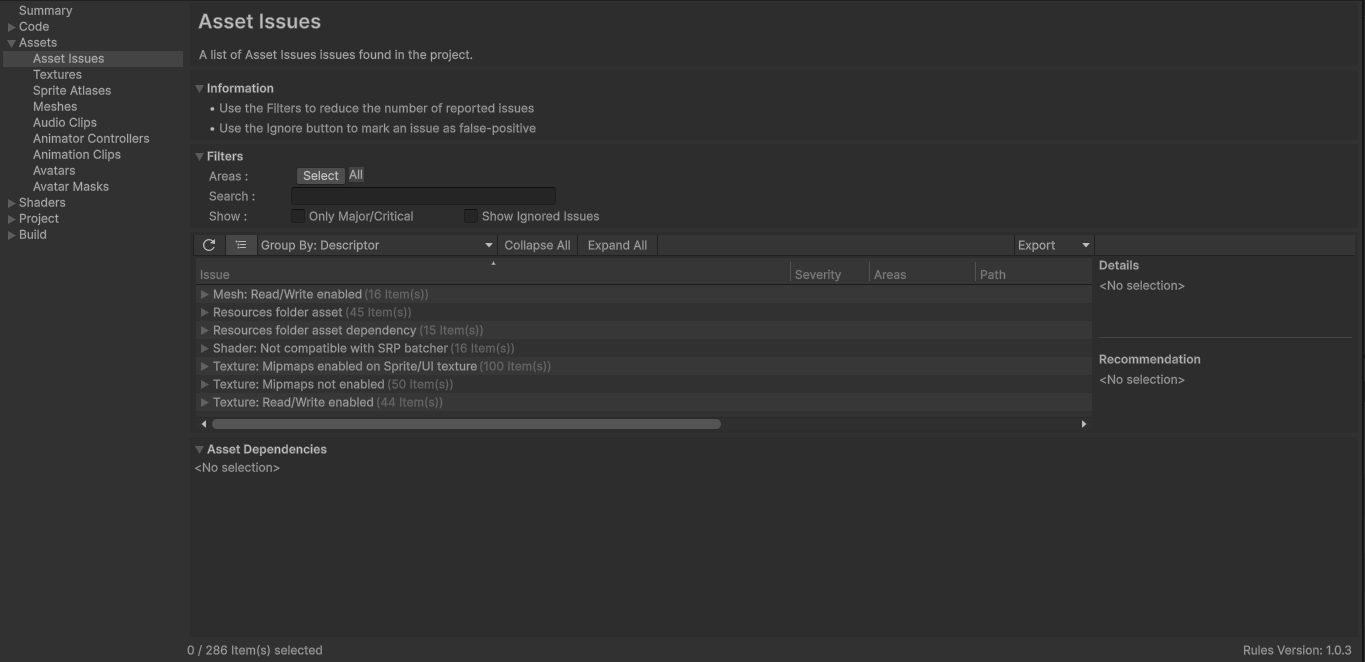
Figure 2.3: The Asset Issues view. Detection example in a project prepared for verification
Expanding a type shows the individual assets, and selecting one shows the details and the recommended action on the right. Once you have the overall picture, look at the breakdown in an individual view such as Textures (Figure 2.4).
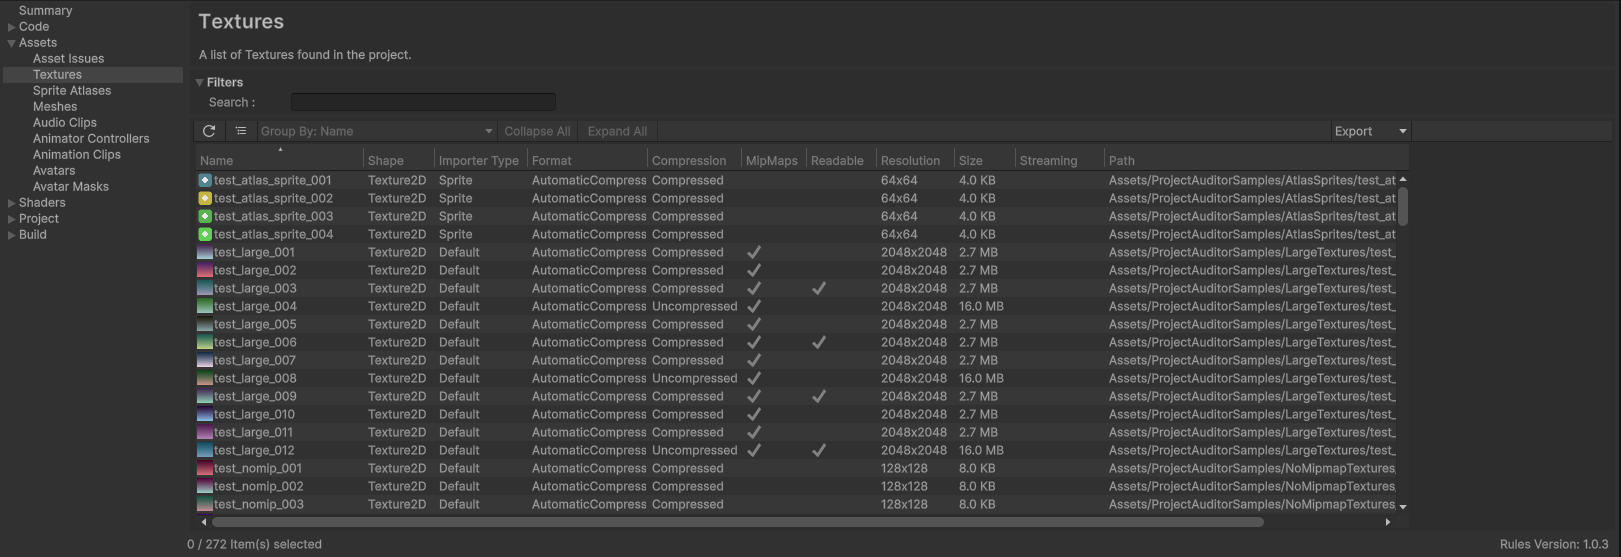
Figure 2.4: The Textures view. Settings and resulting size are displayed side by side
The advantage of this view is that settings and results appear on the same row. Even for the same 2048×2048 texture, the Compressed row occupies 2.7MB and the Uncompressed row occupies 16.0MB. You can see without opening the Inspector that a difference in a single setting produces a nearly sixfold difference. If you sort the Size column in descending order and check Compression, Resolution, and Format from the top, you can find incorrect compression settings, excessive resolution, and wrong format choices.
2.7.3. Reducing the Detection Results
When you run the analysis on a project in live operation, the detection results can exceed several thousand. Trying to work through them from the top in this state does not get anywhere. Narrow the display with Filters in Figure 2.3 shown earlier. Checking Only Major/Critical leaves only high-severity items, and selecting an area in Areas lets you display only the findings related to size. Detected problems are assigned a severity. The documentation describes four levels, Major, Moderate, Minor, and Ignored, but Critical also exists by definition. Ignored is not a severity level but refers to the state that you have specified to ignore. Address issues in order starting from Major, and if Critical is detected, handle it with top priority. Static analysis also flags intended settings, so it is safer to check each item before fixing it. Apply Ignore to findings you judge to be false positives. Ignore is a state recorded in the report that is open, so it is not written to a settings file and is cleared when you rerun the analysis. Judgment parameters such as detection thresholds are saved in ProjectSettings/ProjectAuditorSettings.asset, so committing this file lets everyone share the same values. If you want to suppress a finding permanently, pass a disabling rule to AnalysisParams.WithAdditionalDiagnosticRules in a script on the automated build side.
2.7.4. Integrating into the Automated Build
Project Auditor can also be run from the command line *5. If you integrate it into the automated build and keep the number of detections for each release, you can track which release increased it. Preferences has a setting that logs the number of detections after the build and a setting that treats detections as errors. Before writing your own failure criteria, check whether these are sufficient. On the other hand, no API is provided for comparing two saved reports, so obtaining the difference from the previous run requires your own processing. There are also reports that the automatic analysis after the build never completes and stays stuck, or that the analysis exhausts memory *6. Set a timeout so that an analysis failure does not stop the entire build.
2.8. Conclusion
Countering bloat is a topic where building a mechanism that stops recurrence as a team weighs more than techniques for making individual assets lighter. Standards loosening during operation happens in every project. That is why I feel that the approach that lasts longest is to spend human time on deciding and reviewing the criteria and leave the enforcement to machines. Project Auditor has only just become an official release, but it is sufficiently practical as an entry point for a project that has not had time to establish standards to understand its current state. As a first step, run the analysis once and look at the trends in your own project.