Chapter 5. Unity LTO Settings and Performance Comparison on Android and iOS
The link-time optimization (LTO) setting for Android added in Unity 6000.5 applies only to engine code. A separate setting is required to apply LTO to the code generated from your own C#. We tried both settings and measured performance, binary size, and build time with benchmarks and real titles.
5.1. IL2CPP Compilation and Translation Units
In a Unity Android build (IL2CPP), C# is converted to machine code through the following flow: List 5.1.
List 5.1: IL2CPP build processing flow
1 2 3 4 5 6 7 8 | C# Source ↓ C# Compile IL Assembly (.dll) ↓ IL2CPP Convert A large amount of C++ (.cpp) <- "IL2CPP generated code" ↓ clang Compile with (each .cpp is optimized individually) ↓ Link libil2cpp.so ← C# Final native binary generated from the code |
clang compiles C++ per translation unit (commonly called a TU) and produces object files. A TU is the unit that the compiler reads and optimizes individually.
In a normal C++ build, a function body in another TU cannot be referenced, so even short functions may not be inlined and a call instruction may remain. IL2CPP generated code contains many small functions and safety checks, so it is particularly affected by this constraint. For example, the single C# line buf[idx] becomes roughly the following C++: List 5.2.
List 5.2: Example of array access code generated by IL2CPP
1 2 3 | if (buf == NULL) ThrowNullReferenceException(); // null check if ((uint32_t)idx >= buf->max_length) ThrowIndexOutOfRange(); // bounds check val = buf->m_Items[idx]; |
As the generated code grows, calls across TUs also increase, and so does the total time spent on calls.
5.2. What Are LTO and ThinLTO
LTO (Link Time Optimization) is a clang/LLVM mechanism that performs inlining, constant propagation, and dead code elimination across TUs at link time. At compile time, object files are emitted as LLVM bitcode (an intermediate representation before optimization). At link time, they are optimized together and machine code is generated.
Full LTO merges all intermediate representations into one and optimizes them. It has the widest optimization scope, but because merging and optimizing the intermediate representations are concentrated in a single process, it uses a large amount of memory in large builds. In this case as well, memory usage reached 20 GB during the build of a real title, and the OS forcibly terminated the process.
ThinLTO creates a summary of each TU at compile time. At link time, it imports the required functions from other TUs and optimizes in parallel. It keeps memory usage and processing time lower than full LTO and is widely used in large builds.
5.3. ThinLTO Setting for Engine Code
Unity 6000.5 added a Link Time Optimization toggle.
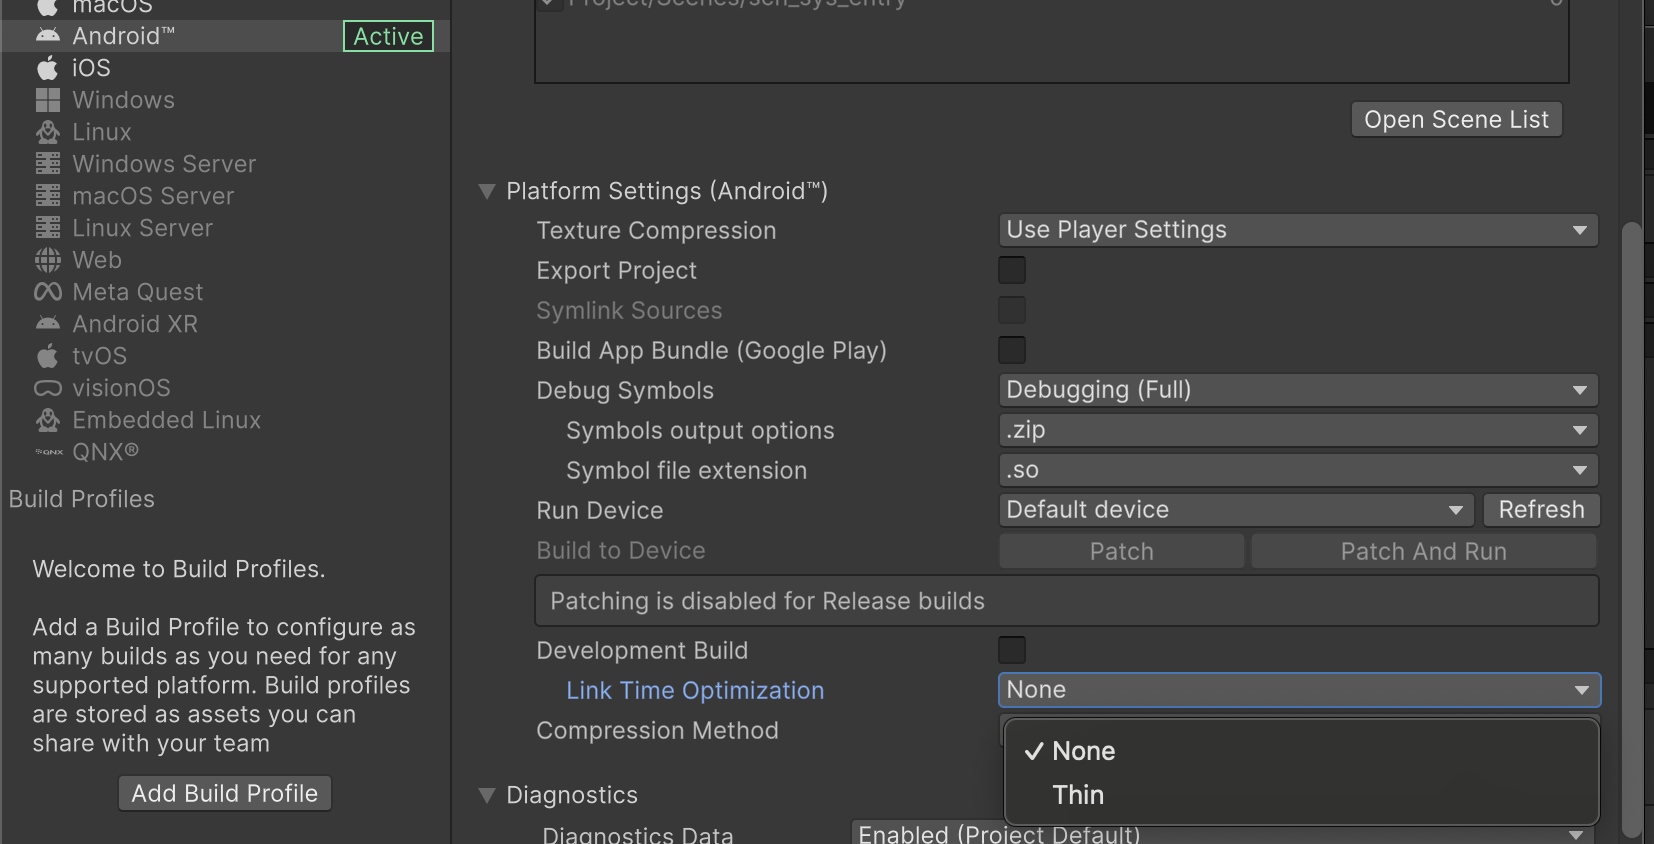
Figure 5.1: Build Profiles > Player Settings > Android
Enabling this toggle selects the engine binary provided by Unity with ThinLTO already applied. It targets Unity engine code and does not include IL2CPP generated code (code derived from C#). The Editor installation folder ships prebuilt .so files for both the regular and ThinLTO variants.
List 5.3: Variants of libunity.so bundled with the Android Player
1 2 3 | PlaybackEngines/AndroidPlayer/Variations/il2cpp/ ├── Release/Libs/arm64-v8a/libunity.so 29,032,960 bytes └── Release_ThinLTO/Libs/arm64-v8a/libunity.so 30,042,536 bytes (+3.5%) |
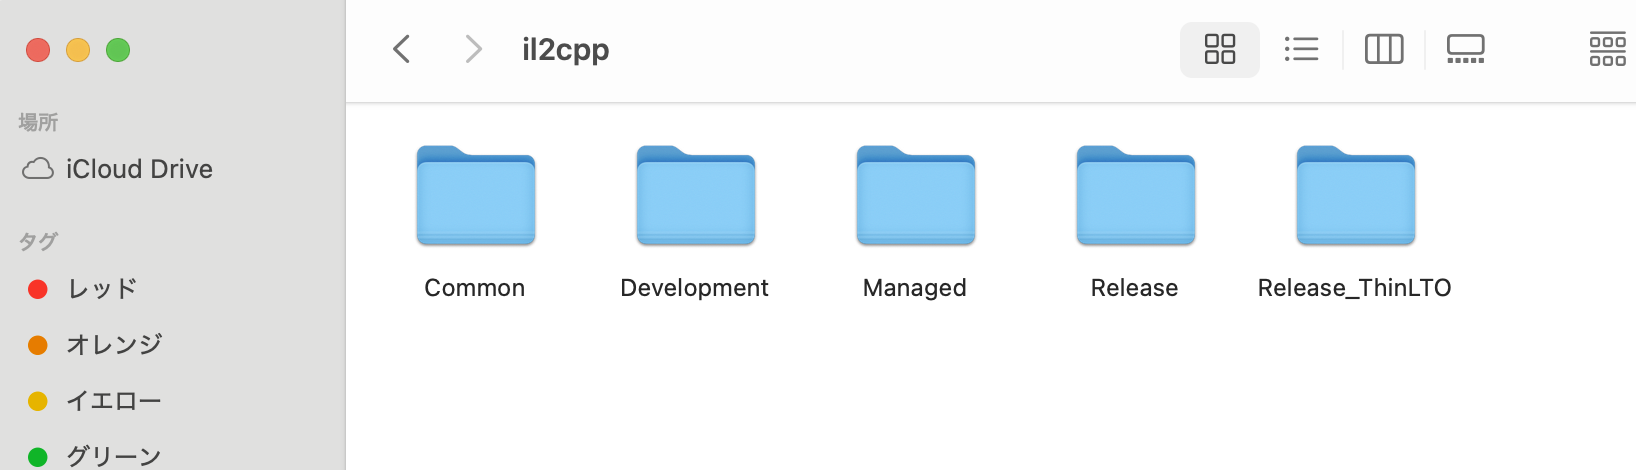
Figure 5.2: The Editor installation folder. Both Release and Release_ThinLTO are included, and one of them is selected at build time
5.3.1. Conditions for Enabling and Behavior When They Are Not Met
The toggle takes effect when the following three conditions are met. If any one is not met, no error or warning is shown, and LinkTimeOptimization is built as None.
- IL2CPP scripting backend
- Strip Engine Code is disabled (because the unstripped prebuilt is used as is)
- Non-Development build
When Development Build is enabled, the toggle itself is not displayed. Whether it is applied can be confirmed with the following two checks: List 5.4.
List 5.4: Command to verify that the engine code LTO toggle is applied
1 2 3 4 | # (1) Check whether ThinLTO is specified in the build input grep -o 'LinkTimeOptimization"[: ]*"[A-Za-z]*"' Library/Bee/Player*-inputdata.json # (2) Check whether libunity.so in the APK matches the Release_ThinLTO variant unzip -p out.apk lib/arm64-v8a/libunity.so | md5 |
5.4. Effect of the engine code LTO toggle
I compared the bundled regular and ThinLTO binaries and measured performance on a physical device, focusing on the subsystems with the most changes.
5.4.1. Comparing Function Sizes in the Bundled Binaries
Unity bundles .so with symbols for both variants in the Editor installation folder.
List 5.5: libunity.so with symbols bundled with the Android Player
1 2 3 | PlaybackEngines/AndroidPlayer/Variations/il2cpp/ ├── Release/Symbols/arm64-v8a/libunity.sym.so └── Release_ThinLTO/Symbols/arm64-v8a/libunity.sym.so |
We matched the function names obtained from llvm-nm --defined-only --print-size --demangle and aggregated them by subsystem using namespaces and class names (Table 5.1).
Table 5.1: Function differences by subsystem due to the engine code LTO toggle
| Subsystem | Number of functions (Release → ThinLTO) | Number of functions with changed size | Size change rate | .text difference |
|---|---|---|---|---|
| Particle | 1,419 → 1,290 | 1,043 | 80.9% | +49.66% |
| Serialization/Asset | 2,890 → 1,387 | 1,040 | 75.0% | -16.61% |
| Mesh/Geometry | 1,055 → 765 | 483 | 63.1% | +6.79% |
| Scripting | 8,924 → 7,680 | 4,302 | 56.1% | +10.27% |
| Gfx/Shader/Texture | 5,062 → 3,935 | 2,044 | 52.1% | +24.21% |
| Physics | 2,680 → 2,439 | 1,229 | 51.1% | +15.92% |
| NavMesh | 739 → 582 | 296 | 51.1% | +11.87% |
| XR/VFX/Video/Other | 3,828 → 2,483 | 1,230 | 49.6% | +13.94% |
| Transform/Scene/Obj | 2,027 → 1,630 | 781 | 47.9% | +10.95% |
| Animation/Mecanim | 3,226 → 2,428 | 1,134 | 46.8% | +13.18% |
| Box2D | 2,169 → 1,562 | 712 | 46.4% | -0.43% |
| JobSystem/Threading | 244 → 181 | 78 | 43.6% | +3.16% |
| UI/UIToolkit | 883 → 701 | 293 | 42.0% | +1.38% |
| TextCore/Font/ICU | 3,500 → 2,101 | 861 | 41.9% | -5.73% |
| (Unclassified) | 29,193 → 21,077 | 7,511 | 37.6% | +3.37% |
| Renderer/Culling | 2,789 → 2,199 | 785 | 35.7% | +27.58% |
| C++ standard/Compression/Infrastructure | 13,158 → 9,484 | 3,071 | 32.6% | -13.31% |
| curl/TLS/HTTP | 1,809 → 1,558 | 318 | 21.0% | +1.17% |
| Audio/FMOD | 2,996 → 2,680 | 496 | 18.5% | +2.77% |
| Android/JNI | 1,445 → 1,186 | 193 | 16.3% | -5.52% |
| PhysX | 6,000 → 5,997 | 0 | 0.0% | -0.05% |
| Total | 96,036 → 73,345 | 27,900 | 38.8% | +4.41% |
Note: "Functions with changed size" is the number of functions. "Size change rate" is the proportion of functions whose size changed among those present in both Release and ThinLTO.
The total function count dropped from 96,036 to 73,345, but the size of .text increased by 4.41%.
5.4.2. Benchmark with 13 Workloads
Based on Table 5.1, I built a benchmark scene that packs 13 workloads into a single APK.
Table 5.2: Benchmark workloads for the engine code LTO toggle
| Workload | Target subsystem | Description |
|---|---|---|
particle | Particle | 20,000 particles + noise/size/color modules, Simulate |
gfx | Gfx/Shader | Write 16 properties × float/vector + matrix to MaterialPropertyBlock and Clear |
cull | Renderer/Culling | CalculateFrustumPlanes + 4,096 AABBs TestPlanesAABB |
physbind | Physics bindings | Rigidbody / Collider property round trips |
anim | Animation | Legacy Animation with 48 rigs × 8 bones × 10 curves, Sample() |
json | Serialization | Round trip of JsonUtility |
instantiate | Serialization | Instantiate → DestroyImmediate (native clone/transfer path) |
xform | Transform/Scene | Rewriting Transforms in a hierarchy |
bind | Scripting bindings | A large number of tiny binding calls |
mesh | Mesh/Geometry | Rebuilding a 96×96 procedural mesh |
phys2d | Box2D | 2D rigid body Simulate |
text | TextCore/Font | TextGenerator.Populate |
physics | PhysX | 3D rigid body Simulate |
Note: Among the Table 5.1 subsystems, those for which it is difficult to create a stable synthetic load of about 100ms per sample from C# were excluded from measurement. Their performance impact was not evaluated.
5.4.3. Measurement Results by Workload
We measured the workloads introduced above on a Pixel 8a (Tensor G3) using APKs that differ only in libunity.so. The ABBA order of Release / ThinLTO / ThinLTO / Release was repeated three times, for a total of 12 sessions. The app was reinstalled for each session, with a 90-second cooldown between sessions.
Values are the time per operation (ns/op). The unit of an operation differs by workload, so compare absolute values only within the same row.
Table 5.3: Benchmark results by workload for the engine code LTO toggle
| Workload | Release (ns/op) | ThinLTO (ns/op) | Difference |
|---|---|---|---|
gfx | 990.46 | 852.49 | -13.93% |
cull | 96,520 | 87,499 | -9.35% |
text | 275,043 | 265,123 | -3.61% |
instantiate | 14,620 | 14,206 | -2.83% |
xform | 6,071.8 | 6,008.1 | -1.05% |
phys2d | 222,269 | 220,327 | -0.87% |
mesh | 2,340,210 | 2,334,143 | -0.26% |
json | 15,864.8 | 15,934.4 | +0.44% |
bind | 140.80 | 141.47 | +0.47% |
physbind | 607.28 | 610.74 | +0.57% |
particle | 265,635 | 267,335 | +0.64% |
anim | 28,100 | 28,563 | +1.65% |
physics | 484,641 | 482,796 | -0.38% |
| [Composite: geometric mean] | 21,918 | 21,380 | -2.46% |
Note: Because the unit differs per row, the composite value is meaningful only as a ratio.
gfx and cull, which improved the most, call small functions from C# millions of times per sample. TextGenerator.Populate in text also runs a per-glyph loop internally. The cross-TU inlining had a large effect on these paths, where each operation is small and the number of calls is high.
5.4.4. Performance, Size, and Memory Comparison at Adoption
In this measurement, CPU time was reduced on some paths with many binding calls. However, the improvement in a real title depends on the proportion of such calls in a frame.
The costs that must be paid on adoption are summarized in Table 5.4.
Table 5.4: Costs of adopting the engine code LTO toggle
| Category | Measured difference |
|---|---|
| Size increase from Strip Engine Code OFF | APK +5.67MB / Installation +20.3MB |
| Memory increase from Strip Engine Code OFF | RSS +18.0MB / of which hard-to-reclaim area +8.0MB |
| engine ThinLTO itself | APK size +398KB (30,621,595 → 31,019,967) / memory not measured |
Note: The installation size increase is the sum of the APK increase and the increase of .so extracted on the device (+14.65MB in total for arm64 .so).
Unity has published results of 10 cold-start measurements on each of five projects for the same toggle. They report that CPU time decreased from 13.88ms to 13.36ms (-3.7%), time to first display decreased from 247.96ms to 229.90ms (-7.3%), APK size increased by +3.3%, and the impact on build time was minor *1.
The CPU improvement is at a level close to this measurement. However, the published APK size increase of +3.3% is a comparison between configurations that both disable Strip Engine Code, so it does not include the installation size increase of +20.3MB and the memory increase of +8.0MB that accompany the disabling.
5.5. How to Apply LTO to libil2cpp.so
To apply LTO to libil2cpp.so that includes code converted from C#, you can use Unity's Master configuration or pass clang flags directly.
5.5.1. Master Configuration and the IL2CPP LTO Mode Setting
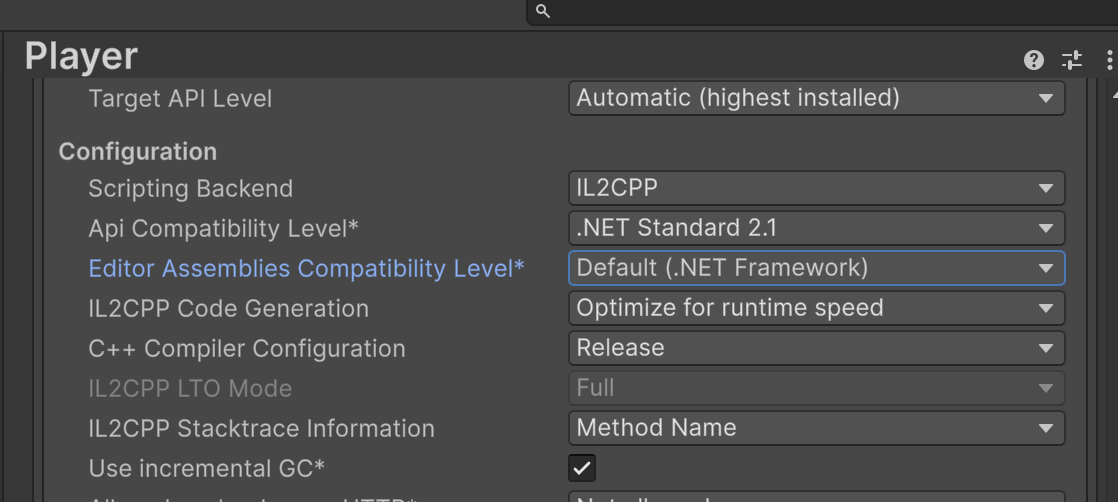
Figure 5.3: Settings screen for IL2CPP LTO Mode and C++ Compiler Configuration
Setting C++ Compiler Configuration in Player Settings > Configuration to Master enables LTO for libil2cpp.so. IL2CPP LTO Mode is the item that selects the Thin / Full mode used in that case.
According to Unity's official article, IL2CPP LTO Mode was added in 6000.5. On Android before 6000.5, there is no difference between Release and Master regarding the presence of LTO. However, in 6000.5 the toggle cannot be selected on the Android platform and is fixed to Thin; from 6000.6, Thin / Full can be selected in the Master configuration. Even as of 6000.7, there is no option that enables only LTO while keeping the Release configuration.
The flags corresponding to C++ Compiler Configuration in Player Settings can be checked in IL2CPP compiler configuration in the Bee build graph (Il2CppCompilerConfiguration).
Table 5.5: Compiler flags by Unity C++ Compiler Configuration
| Version | Release | Master |
|---|---|---|
| Android 6000.3 (arm64) | -Os (size-oriented), no LTO | -Os, no LTO (identical) |
| Android 6000.5 (arm64) | -Os | -O2 (optimization balancing speed and code size) + ThinLTO |
| iOS 6000.3 / 6000.5 | -O3 (optimization that pursues speed more aggressively at the cost of possible code size growth), LTO OFF | -O3, LTO OFF (identical) |
5.5.2. Adding -flto=thin to the Release Configuration
As described above, switching to the Master configuration is the fastest way to obtain the effect of LTO, but the optimization level also changes from -Os to -O2 at the same time as LTO (Table 5.5), and the drawbacks are increased size and build time. If you keep the Release configuration and apply only ThinLTO, you can measure the effect of LTO separately and also limit the increase in size and build time. To apply ThinLTO to libil2cpp.so generated from your own C#, you can pass clang flags directly, as in List 5.6.
List 5.6: Build preprocessing that enables ThinLTO in the Release configuration
1 2 3 4 5 6 7 8 9 10 11 12 13 | // Save the existing additional arguments → append → always restore var saved = PlayerSettings.GetAdditionalIl2CppArgs(); try { var extra = "--compiler-flags=-flto=thin --linker-flags=-flto=thin"; PlayerSettings.SetAdditionalIl2CppArgs( string.IsNullOrEmpty(saved) ? extra : saved + " " + extra); BuildPipeline.BuildPlayer(options); } finally { PlayerSettings.SetAdditionalIl2CppArgs(saved); } |
Verify whether it has been applied in two steps (List 5.7).
The first is whether the flag was passed to the build commands. Unity's build system (Bee) records the compile and link commands it executed in Library/Bee/Player*.dag.json. Search this file with -flto=thin and check that the flag is included in both the compilation of the IL2CPP-generated code and the link of libil2cpp.so.
The second is whether the generated object files are LLVM bitcode. When LTO is enabled, the compile output .o is bitcode instead of machine code. Select one output file of a compile command found in the first step and display its first 4 bytes.
List 5.7: Commands to confirm IL2CPP ThinLTO is applied
1 2 3 4 | # 1. Check whether the compile and link commands contain -flto=thin rg -n -- '-flto=thin' Library/Bee/Player*.dag.json # 2. First 4 bytes of the generated object (specify the .o found in 1.) xxd -l 4 Library/Bee/artifacts/Android/.../GeneratedCode.o |
For bitcode, 4243 c0de (BC..) is displayed; for an ordinary machine-code object, 7f45 4c46 (.ELF) is displayed. If you pick an arbitrary .o in the folder, you may pick up an object of a third-party library that is not subject to LTO. For the second command, always specify a file that appeared in the search results of the first.
5.5.3. Benchmark Design
Generating Synthetic Code
This benchmark mainly measures calls across TUs, which normal compilation cannot optimize. An asmdef boundary and a C++ TU boundary are not the same concept, so I checked the generated C++ after IL2CPP conversion and also confirmed in the Bee compile graph that the caller and callee fall into different TUs. The code generator produces the following.
- 16 asmdef assemblies × 24 classes × 8 methods = 3,072 methods
- One round of the call chain passes through 16 assembly boundaries, and every method additionally calls helpers in a shared assembly (
Core.Mix/Core.Idx/ struct operations) - The benchmark visits all classes, so managed stripping does not remove them
- A different constant per method prevents folding by ICF
An example of the 3,072 generated methods is shown in List 5.8.
List 5.8: Example of a method generated by the synthetic benchmark
1 2 3 4 5 6 | public static int M2(int sel, int x, int[] buf) { x = Core.Mix(x, 655663086); // Cross-boundary call to the shared assembly x += buf[Core.Idx(x, 7)]; // Array access with bounds check (Idx is masked with & 1023) return M3(sel, x, buf); // Small function chain } |
Two Workloads
Table 5.6: Synthetic benchmark workloads for IL2CPP ThinLTO
| Workload | What it measures |
|---|---|
| direct | Cross-assembly static call chain (the form where LTO should be most effective) |
| iface | The same kind of operations run through interface dispatch (a form where LTO has difficulty resolving the callee directly) |
Both are self-contained within libil2cpp.so. For the binary generated in each configuration, I verified the md5 of libil2cpp.so extracted from the APK every time. The iteration count is adjusted at run time so that one sample takes about 100ms. Because the count differs per run, values are normalized to the time per pass for comparison.
In iface, four classes implementing IGenOp are generated for each assembly (64 in total), and the benchmark calls them in turn through the interface (List 5.9). The method body calls the same Core.Mix / Core.Idx as direct, but which class's Apply is called is determined at runtime.
List 5.9: Classes and call loop generated for the iface workload
1 2 3 4 5 6 7 8 9 10 11 12 13 14 15 | sealed class Op0 : IGenOp { int m_State = 20612; public int Apply(int x, int[] buf) { x = Core.Mix(x, 347275849); // Cross-boundary call to the shared assembly x += buf[Core.Idx(x ^ m_State, 7)]; // Array access of the same kind as direct m_State = (m_State + x) | 1; return x; } } // Benchmark side: iterate over the 64 implementations through the interface for (int i = 0; i < ops.Count; i++) a += ops[i].Apply(a ^ p, buf); // The callee is determined at runtime |
5.5.4. CPU Measurements (Pixel 8a)
Table 5.7: CPU measurement results of IL2CPP ThinLTO on a Pixel 8a
| Configuration | direct (us/pass) | iface (us/pass) |
|---|---|---|
| off(Release, -Os) | 19.88 | 0.404 |
| thin (manual ThinLTO) | 15.54 (-21.8%) | 0.375 (-7.3%) |
Manual ThinLTO reduced direct by 21.8% and iface by 7.3%.
Function calls and instruction counts in direct
For the same call structure as in §5.3.1, I compared the disassembly with and without LTO.
Table 5.8: Disassembly comparison of the direct workload
C000_M2 | No LTO | ThinLTO |
|---|---|---|
| Instruction count | 15 | 11 |
Function calls (bl) | 2 | 0 |
| Stack frame | Yes | No |
| Saving of callee-saved registers | x19, x20, x29, x30 | None |
| Memory accesses | 5 | 1 |
The bodies of Core.Mix and Core.Idx are expanded into the caller, which removes two bl instructions and the stack and register save processing. Expressions spanning both functions are also optimized together. The 21.8% reduction in direct is the result of this change accumulating over 3,072 methods.
Why the improvement in iface is small
An interface call generated by IL2CPP has, in outline, the form List 5.10.
List 5.10: Outline of the interface call code generated by IL2CPP
1 2 3 | const VirtualInvokeData& invokeData = il2cpp_codegen_get_interface_invoke_data(slot, obj, declaringInterface); return ((Func)invokeData.methodPtr)(obj, p1, p2, invokeData.method); |
The callee is a invokeData.methodPtr obtained at run time, so it cannot be resolved to a direct call like a normal C++ vtable call. However, the part where the method body calls a helper in another TU can be inlined, and iface also improved by 7.3%.
If interface / virtual calls are taking a long time, you can also consider sealed, receiving concrete types, and static dispatch via generics. What ThinLTO improves readily is the part that statically calls small functions in other TUs.
5.5.5. Size and Build Time
Table 5.9: Size and build time of IL2CPP ThinLTO
| Configuration | libil2cpp.so (MB) | text of the same | Cold build |
|---|---|---|---|
| off | 37.36 | baseline | 62s |
| thin | 38.16 (+2.2%) | +2.3% | 71s (+15%) |
In this configuration, libil2cpp.so increased by 2.2% due to inline expansion. LTO can also remove dead code, so the direction of the size change depends on the codebase and the optimizations applied. The cold build increased 15%, from 62s to 71s. With ThinLTO, cross-TU optimization and machine code generation are performed at link time, so the link time increases accordingly.
5.6. Optimizations Enabled by the Master Configuration
In the Master configuration, the optimization level also changes at the same time as LTO (Table 5.5). To find out which setting is responsible for the CPU time reduction, we measured each separately. To examine the effects of the optimization level (-Os → -O2) and of LTO separately, I measured a 2×2 matrix of {-Os, -O2} × {no LTO, ThinLTO} (Android 6000.5 / arm64).
Table 5.10: CPU measurement comparison of optimization levels and ThinLTO
| direct (us/pass) | No LTO | ThinLTO |
|---|---|---|
| -Os (Release) | 19.64 (baseline) | 15.54 (-20.9%) |
| -O2(Master) | 18.47 (-5.9%) | 15.54 (-20.9%) |
Table 5.11: libil2cpp.so size comparison of optimization levels and ThinLTO
| libil2cpp.so | No LTO | ThinLTO |
|---|---|---|
| -Os | 37.36MB | 38.16MB (+2.2%) |
| -O2 | 39.14MB | 44.14MB (+12.8%) |
The CPU time reduction was 5.9% with -O2 alone and 20.9% in the configuration including ThinLTO. In this benchmark, most of the Master configuration's improvement was obtained from ThinLTO. Release + manual ThinLTO and Master had the same CPU time of 15.54us, but the final libil2cpp.so sizes were 38.16MB and 44.14MB, and Release + manual ThinLTO was about 13.5% smaller.
Table 5.12: Cold build time of Release + ThinLTO and Master
| Configuration | Cold build |
|---|---|
Release (-Os, no LTO) | 62s |
| Release + ThinLTO | 71s (+15%) |
Master (-O2 + ThinLTO) | 86s (+39%) |
The cold builds took 71s and 86s, so the configuration that adds only ThinLTO to Release was 15 seconds shorter. In Unity's published measurements as well, the Master configuration (on the libil2cpp.so side) showed CPU -2.3%, time to first display -5.7%, libil2cpp.so size +18.7%, and build time +30 to 35%. The CPU improvement was -2.3% in Unity's results, versus -20.9% in this chapter's benchmark. However, Unity measured the entire main thread of real projects, whereas this chapter measured only the path that repeatedly calls small functions so the numbers cannot be compared directly. On the other hand, size and build time in this chapter's Master are +18.2% and +38.7%, close to Unity's published values.
5.7. Verification on real titles
We also tried ThinLTO on two real titles that are larger than the benchmark. Table 5.13 shows the Unity version, number of assemblies, amount of source code, and binary size.
Table 5.13: Unity version and code scale of the real titles
| Item | Title A | Title B |
|---|---|---|
| Unity version | 6000.5.3f1 | 6000.3.15f1 |
| Number of assemblies in the player | 158 | 285 |
Compiled .cs | 6,969 files | 16,700 files |
| Lines of the same | About 1.38 million lines | About 3.19 million lines |
| Of which in-house code | 1,943 files / about 350,000 lines | 8,606 files / about 1.54 million lines |
libil2cpp.so (uncompressed) | 189.0MB | 294.3MB |
5.7.1. Size and application check for Release + ThinLTO
Table 5.14: Size and build time of Title A
| Item | baseline | ThinLTO | Difference |
|---|---|---|---|
| libil2cpp.so (uncompressed) | 189.01MB | 194.70MB | +5.69MB (+3.0%) |
Same .text | 8.54MB | 8.98MB | +0.44MB (+5.1%) |
| APK | 165.85MB | 166.94MB | +1.08MB (+0.65%) |
| Player build portion | about 396s | about 433s | about +9% |
.text +5.1% is larger than the benchmark (+2.3%), consistent with the expectation that the more finely asmdefs are split, the more cross-module inlining occurs. Even with a 189MB libil2cpp.so, the ThinLTO link completed on a local machine.
For Title B, we compared the size of each section of libil2cpp.so using llvm-readelf -S (Table 5.15).
Table 5.15: Section differences of libil2cpp.so in Title B
| Item | baseline | ThinLTO | Difference |
|---|---|---|---|
| libil2cpp.so (whole file) | 294.30MB | 304.12MB | +3.34% |
il2cpp | 145.85MB | 162.22MB | +11.23% |
.text | 10.69MB | 11.14MB | +4.18% |
.rela.dyn | 50.28MB | 45.01MB | -10.48% |
.got | 1.76MB | 1.4KB | -99.92% |
.gcc_except_table | 3.70MB | 3.62MB | -2.32% |
The .text increase of 4.18% falls between Title A (5.1%) and the benchmark (2.3%). .got decreased from 1.76MB to 1.4KB. This indicates that LTO resolved cross-module references and converted indirect references through the GOT into direct references. The 10.5% reduction in .rela.dyn, which includes dynamic relocation entries, corresponds to this change as well.
5.7.2. Master and full LTO on a real title (Title A)
We tried the comparison of the Master configuration and full LTO from §6 at real-title scale.
Table 5.16: Build configuration comparison of Title A
| Title A | baseline | Release + thin | Master | full LTO |
|---|---|---|---|---|
| libil2cpp.so | 189.0MB | 194.7MB (+3.0%) | 222.2MB (+17.6%) | — |
| Build | 453s | 465s | 537s (9 min) | failed after 2,903s (48 min) |
| Peak RSS on the linker path | — | — | 12.9GB | 20GB → Killed: 9 (OOM) |
With full LTO, after 48 minutes of building, memory usage during linking reached 20 GB and the OS forcibly terminated the process. In the benchmark in §5.3 as well, full LTO kept CPU time on par with ThinLTO while the cold build became about 3.5 times longer, from 71s to 247s. The build could not be completed for this title, and ThinLTO was more practical.
The size of Master's libil2cpp.so increased by about 33MB from the baseline, but CPU performance was on par with Release + thin. With Release + thin, the size increase stays at about 5.7MB, so for this title as well, performance equivalent to Master was obtained with a smaller binary.
5.7.3. CPU cycles on a real title (Title B)
On a steady-state out-of-game screen, we measured the sum of the CPU cycles of all threads on a Pixel 8a. ThinLTO and the baseline were measured alternately for three sessions each, and the value of each session is the average of six 20-second measurements.
Table 5.17: CPU cycles by session for Title B
| Session | Total cycles (Gcyc) | UnityMain (Gcyc) |
|---|---|---|
| ThinLTO #1 | 44.88 | 27.48 |
| ThinLTO #2 | 45.18 | 27.36 |
| ThinLTO #3 | 45.54 | 27.60 |
| baseline #1 | 46.06 | 29.05 |
| baseline #2 | 45.71 | 27.89 |
| baseline #3 | 46.15 | 28.23 |
| Average (ThinLTO vs baseline) | 45.20 vs 45.97 → -1.68% | 27.48 vs 28.39 → -3.21% |
5.7.4. Comparison with Unity's published values
I compare the values Unity published for the Master configuration (on the libil2cpp.so side) with the results of Title B. The benchmark results from §6 are also listed.
Table 5.18: Comparison of Unity's published values and this chapter's measurement results
| Metric | Unity published (6 projects, Master) | Benchmark | Title B |
|---|---|---|---|
| CPU | Main thread -2.3% | direct -21.8% | UnityMain -3.21% / total cycles -1.68% |
libil2cpp.so | +18.7% | +2.2%(Release+thin)/ +18.2%(Master) | +3.0% |
| Build time | +30 to 35% | +15% (Release+thin) / +38.7% (Master) | +9 to 15% |
Unity's CPU time reduction of -2.3% and Title B's UnityMain -3.21% were both improvements of a few percent. The gap from the benchmark's -21.8% can be explained by the fact that measurements of real titles also include processing outside LTO's scope. A similar tendency is seen in the six projects Unity measured.
Size and build time differed by configuration. Unity's published values for the Master configuration are +18.7% and +30 to 35%, respectively. They were close to the Master configuration measured in this chapter: +18.2% (44.14MB / 37.36MB) and +38.7% (86s / 62s). The baseline libil2cpp.so sizes are also close, at 37.26MB / 37.36MB.
Adding only ThinLTO to Release gave equivalent CPU performance with +2 to 3% size and +9 to 15% build time. From the 2×2 comparison in §6, the increases in size and build time in the Master configuration are considered to come mainly from the change to -O2.
5.7.5. Optimization scope and improvement on real titles
In Title B, the improvement is concentrated on the main thread. While UnityMain decreased by -3.21%, all non-UnityMain threads together changed by +0.8%, which is within the 4% drift between sessions.
In the binaries as well, .so other than libil2cpp.so is almost unchanged. Two native plugins have identical md5, and the difference in .text of the remaining one is +0.008%, within the range of build nondeterminism. The optimization by --compiler-flags this time did not reach these plugins.
UnityMain's -3.2% is smaller than the benchmark's -22%. On this screen, facial expressions, blinking, hair and clothing sway, IK, and so on run as jobs. These are contained in native binaries outside libil2cpp.so and are outside the scope of the optimization by this flag.
The improvement for IL2CPP generated code alone, excluding the out-of-scope processing, is considered larger than the -3.21% of UnityMain as a whole. However, determining the exact value requires separating the in-scope and out-of-scope processing time with the Profiler. Jobs are also executed on the main thread by scheduling, so UnityMain's measurement also includes out-of-scope processing.
5.8. Applying ThinLTO on iOS
I also applied ThinLTO to the iOS version of Title B. The effect was confirmed in the validation benchmark, but the real title did not gain an improvement that justified the increase in build time.
5.8.1. LTO structure on iOS
Table 5.19: Comparison of the LTO structure on Android and iOS
| Aspect | Android | iOS |
|---|---|---|
| il2cpp output | libil2cpp.so | libGameAssembly.a |
| Final link | LLD called by il2cpp | ld64 when Xcode creates UnityFramework |
| Arguments passed | --compiler-flags=-flto=thin --linker-flags=-flto=thin | --compiler-flags=-flto=thin only |
| Where build time increases | Unity build step | Build ipa (xcodebuild) step |
On iOS, il2cpp only creates an archive, so --linker-flags is not passed. LTO code generation happens at link time on the Xcode side, which reads the archive containing this bitcode.
Because il2cpp is responsible for compiling the generated code, the flag must be specified in AdditionalIl2CppArgs. Changing LLVM_LTO = YES_THIN in Xcode does not apply to the generated code.
Engine code is provided as a prebuilt libiPhone-lib.a and has no bitcode, so it is not subject to LTO. There was also no setting to swap in an LTO-applied engine, like the Android engine code LTO toggle (§3).
5.8.2. Verification benchmark on iPhone 13
First, we ported the same verification benchmark as in §5.3 to iOS and checked whether ThinLTO on generated code also works on iOS. direct consists of 3,072 small methods divided into 16 asmdefs a configuration in which ThinLTO is most likely to show an effect. Therefore, the improvement rate here is not a value obtainable as is in a typical title, and should be treated as close to the upper bound when conditions are favorable.
The device is an iPhone 13 (iPhone14,5 / iOS 18.7.8). I used Unity 6000.5.3f1, IL2CPP Release, and OptimizeSpeed. The only difference between baseline and ThinLTO is the presence of --compiler-flags=-flto=thin. Xcode is ReleaseForRunning, development signing is get-task-allow=true, and Unity's Development Build is disabled.
For each session, I uninstalled, reinstalled, and launched the app, and recorded 30 samples after five warmups. The measurement order was baseline / ThinLTO / ThinLTO / baseline for three blocks, for a total of 12 sessions. The thermal state was Nominal in all sessions. The iteration count is adjusted automatically per session, so direct and iface are normalized per pass, and Physics per step.
Table 5.20: iPhone 13 validation benchmark results
| Workload | baseline | ThinLTO | Difference |
|---|---|---|---|
direct | 21,231.31ns/pass | 16,184.31ns/pass | -23.77% |
iface | 366.96ns/pass | 370.39ns/pass | +0.93% |
| Physics (out-of-scope control) | 147.82us/step | 147.36us/step | -0.31% (distributions overlap) |
direct was -23.6 to -23.9% in all three blocks, and all baseline and ThinLTO sessions were completely separated. It is also close to Android's -21.8% (§5.4), which confirms that ThinLTO on generated code actually works on iOS as well. On the other hand, iface worsened slightly, and the out-of-scope Physics showed no difference. ThinLTO's effect is concentrated on paths where static small function calls cross TUs. The binary sizes of the same benchmark are shown in Table 5.21.
Table 5.21: Binary size of the iPhone 13 validation benchmark
| Item | baseline | ThinLTO | Difference |
|---|---|---|---|
| UnityFramework | 98.76MB | 107.52MB | +8.76MB(+8.87%) |
__text | 20.09MB | 20.46MB | +0.37MB(+1.83%) |
il2cpp | 22.49MB | 30.78MB | +8.30MB(+36.89%) |
5.8.3. Results for Title B and the reason adoption was skipped on iOS
Next, we applied ThinLTO to the iOS version of Title B. Table 5.22 shows the size of UnityFramework and Table 5.23 shows the build time.
Table 5.22: Section differences of iOS UnityFramework
| Section | baseline | ThinLTO | Difference |
|---|---|---|---|
| UnityFramework (whole file) | 316.53MB | 393.47MB | +24.31% |
__TEXT (segment) | 261.83MB | 338.53MB | +29.29% |
il2cpp | 167.02MB | 240.26MB | +43.85% |
__text | 57.99MB | 61.70MB | +6.41% |
__gcc_except_tab | 6.85MB | 6.63MB | -3.16% |
__unwind_info | 3.44MB | 3.38MB | -1.75% |
__got | 18.8KB | 18.8KB | ±0 |
| ipa (whole archive) | 233.83MB | 246.93MB | +5.60% |
Table 5.23: iOS build time
| Step | baseline | ThinLTO |
|---|---|---|
Build ipa(xcodebuild) | 357s(5m57s) | 3,094s(51m34s) |
UnityFramework increased by +24.31% and the ipa by +5.60%. The build time increased about 9 times, by 46 minutes. Most of the increase came from linking on the Xcode side and dsymutil, and it is substantially longer than the +9 to 15% on Android. A configuration with GCC_OPTIMIZATION_LEVEL lowered to -Os (-Os + thin) still took 53m51s and did not shorten it.
On Title B's steady-state screen, the simple average of cpu/wall worsened slightly with ThinLTO by +1.08%, and even among pairs with matching thermal states, the improvement was only -1.45%. The distributions of baseline and ThinLTO overlapped, and a large CPU improvement could not be isolated. The memory difference of +0.40% is also below the within-session variation. The validation benchmark's -23.77% is a value obtained by concentrating calls favorable to ThinLTO, and did not apply to the real title as a whole.
We could not confirm a clear improvement on a real title, and an additional time of about 46 minutes would be required for every cold build or CI run, so in this verification we decided not to adopt manual ThinLTO on iOS.
5.9. Adopting it in your own title
On Android, we recommend first adding -flto=thin to the Release configuration. In this benchmark, it gave CPU performance equivalent to Master with a smaller binary and a shorter build time. On the steady-state screen of a real title as well, total cycles decreased by 1.68% and UnityMain by 3.21% (§7.3).
We do not recommend the engine code LTO toggle (§3) in this configuration, because disabling Strip Engine Code causes a large increase in size and memory.
Manual ThinLTO on iOS did not provide an improvement commensurate with the increase in build time, so we decided not to adopt it.
Before adoption, examine the scripting time in the PlayerLoop with a Profiler capture of a Release build. The target of the manual flag is within libil2cpp.so; the render thread, GPU, engine internals, and GC are not targets. Jobs compiled by a separate AOT pipeline are also not included (§7.5). For titles that use DOTS/Jobs heavily, also check their processing time.
For example, if scripting takes 8 ms of a 33 ms frame, even a reduction of about 20% in that part shortens the whole frame by only about 1.6 ms. Consider adopting it only if scripting accounts for a large share of the whole frame and there is room for improvement, or if a high frame rate must be maintained.
If the increase in build time hampers daily development work, you can apply it only to builds from staging onward and not to everyday development builds. Because the flag is added in the build preprocessing (List 5.6), it can be switched for each type of build.
After configuring, confirm the application using the procedures in §3.1 and §5.2. The places to check are inputdata, the binary md5, -flto in the compile command, and the bitcode of object files. A build may succeed even when the LTO conditions are not met, so the build result alone cannot tell you whether it was applied.
[*1] Unity Android platform team, "Boosting Android performance with LTO optimizations in Unity 6.5" https://discussions.unity.com/t/boosting-android-performance-with-lto-optimizations-in-unity-6-5/1720008. Hereafter, "Unity's published values" in this chapter refers to the numbers in this article.