Chapter 2. Automating Physical-Device Profiling of Daily Builds
In most cases, profiles on physical devices are taken only when someone thinks they are needed. Before a release, someone connects the Profiler, finds a spike or a memory increase, and searches for the commit that caused it. In this flow, the range in which to look for when things got worse tends to be several weeks of diffs. This chapter covers a setup that automatically runs measurement on physical devices with every daily build.
The setup consists of three components: a device farm that lends out physical devices, a remote control server embedded in the app that accepts operations from outside, and a measurement SDK that sends measurement data to a server. The job borrows a physical device remotely from the device farm, navigates through the game's screens in turn with the remote control, and sends memory snapshots and Profiler captures with the measurement SDK. If you add this to CI as a job that follows the daily build, per-commit measurement data accumulates with every build. The accumulated data can be retrieved from the command line, so it also serves as an entry point for having an AI agent read the differences and proceed as far as a fix proposal.
This chapter explains the daily patrol workflow operated in an internal project and the improvements made along the way. At the time of writing, only Android devices are targeted; iOS support is planned.
2.1. Connect a measurement job after the build
The pipeline proceeds in the order Figure 2.1. Securing a device, operating the app, and sending measurement data are each handled by a separate tool. This division of roles still works even if you replace any of them with another tool.
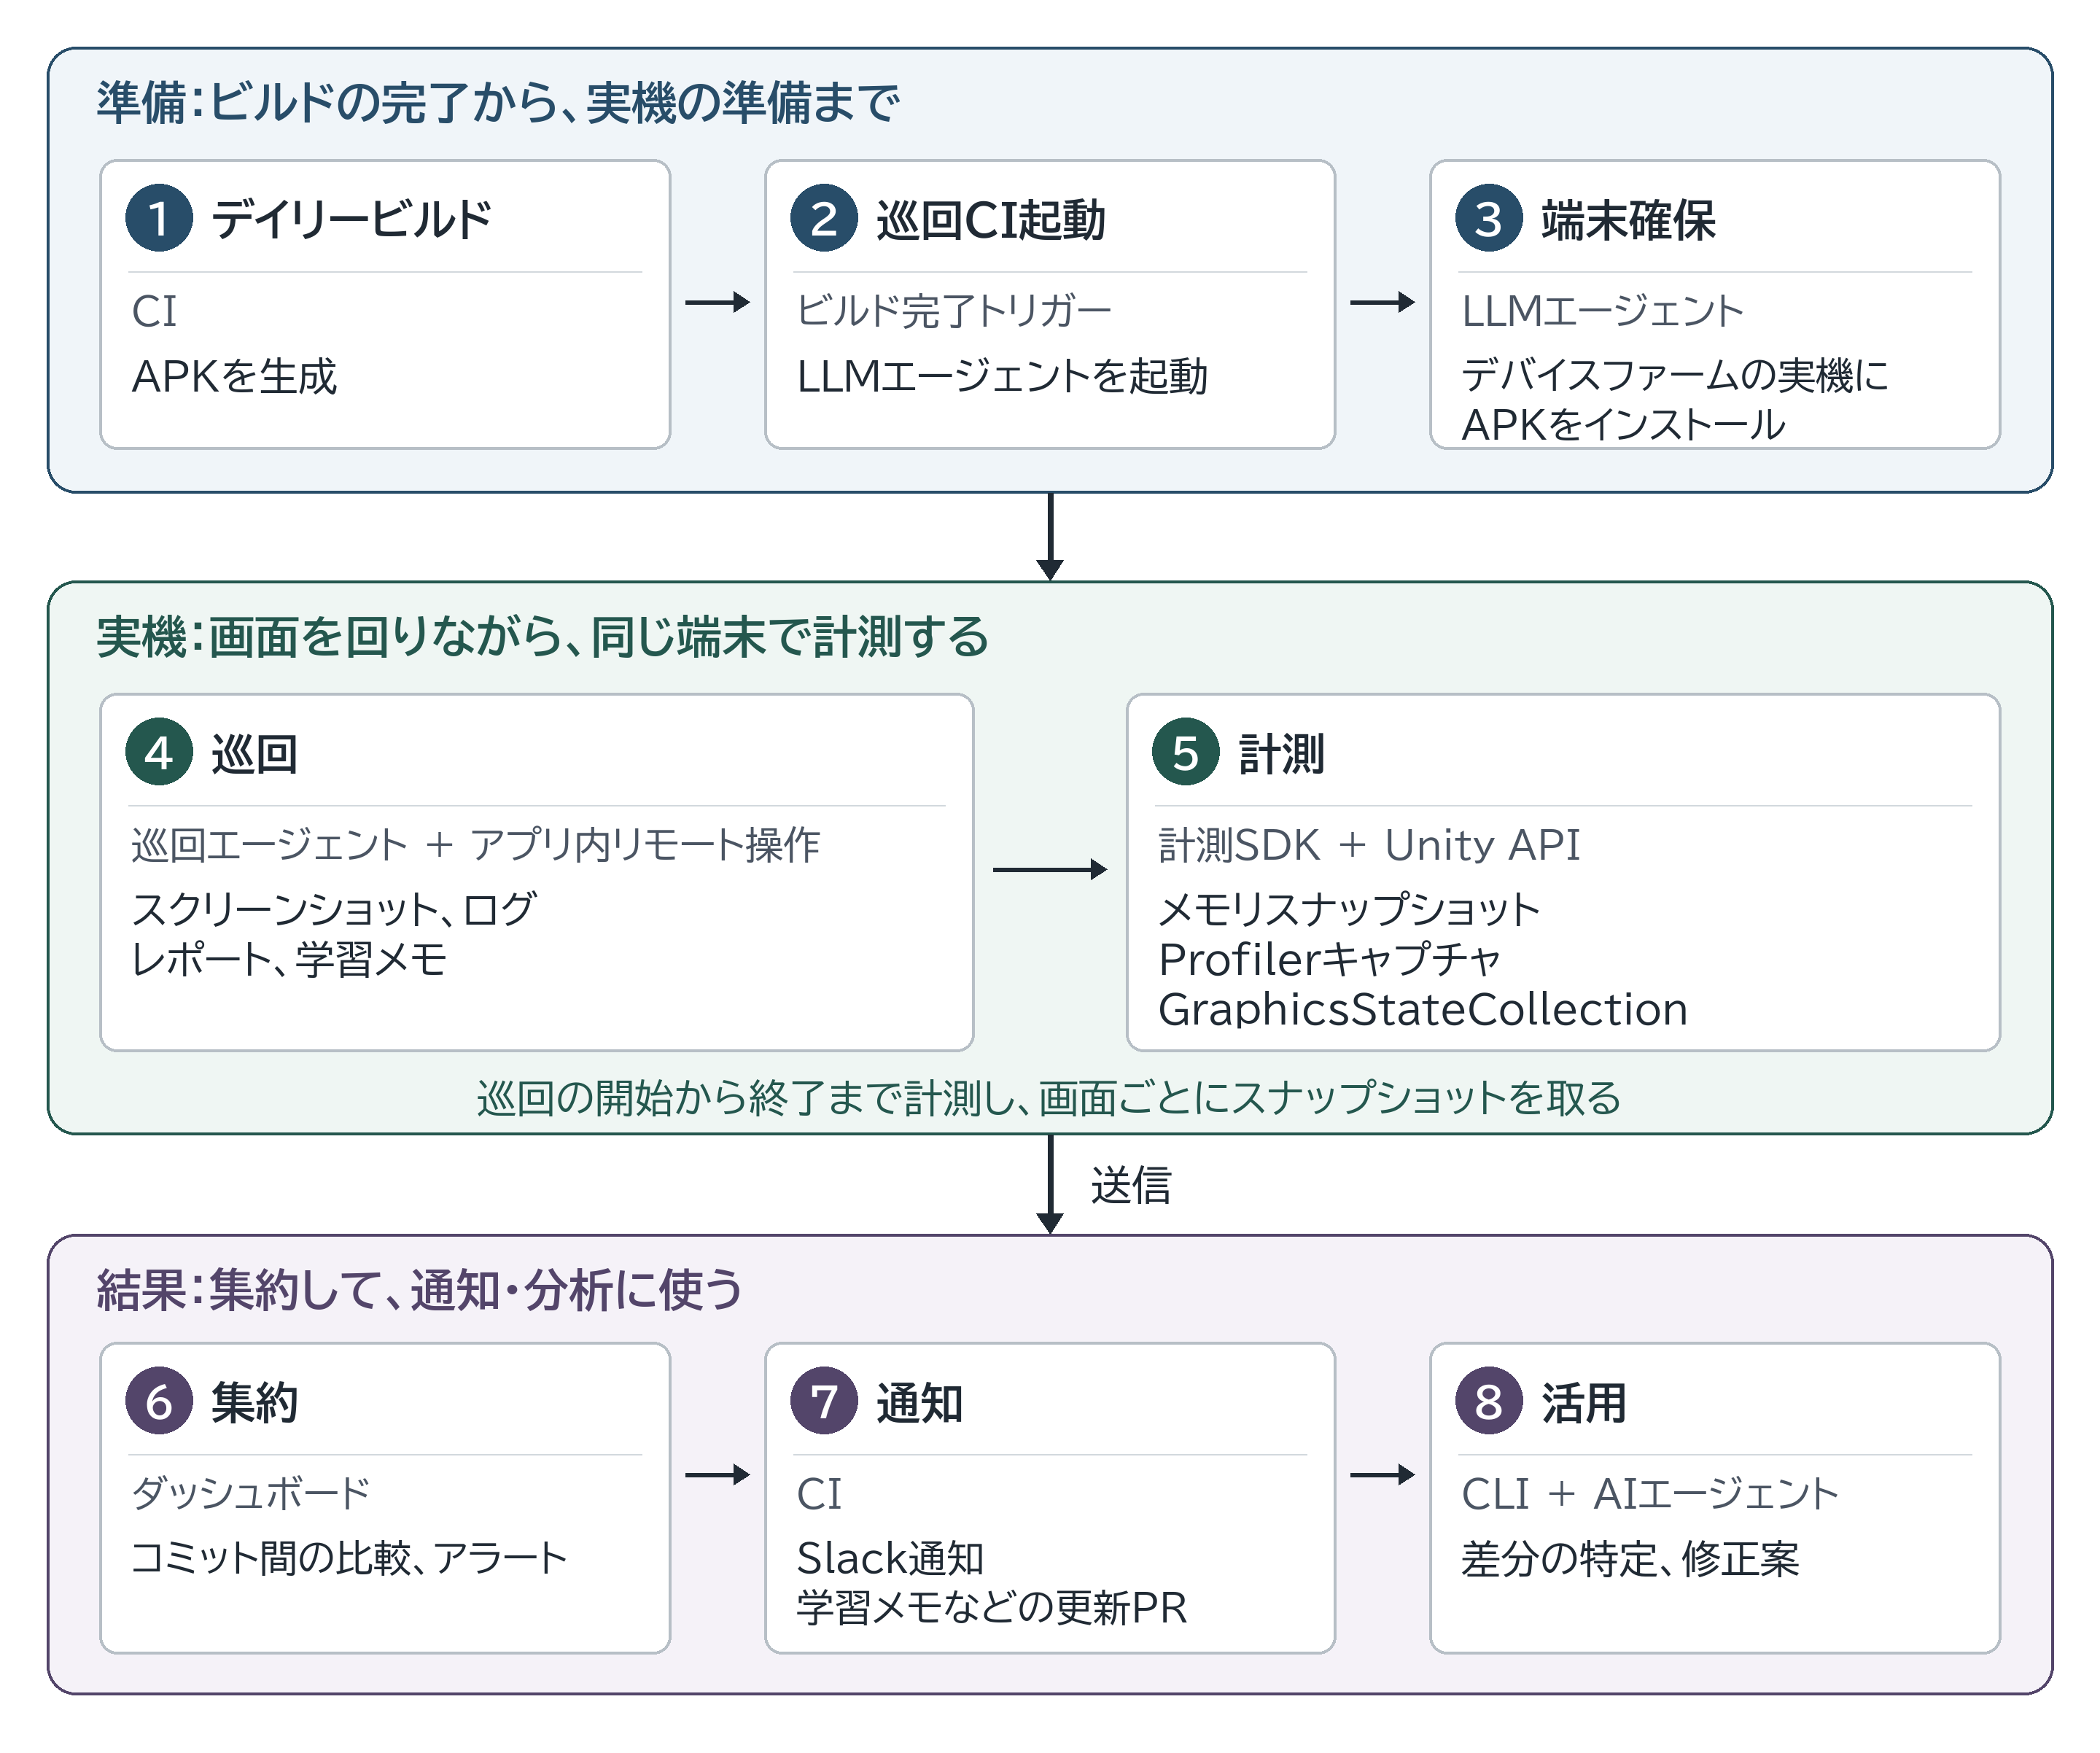
Figure 2.1: Stages of the daily measurement pipeline
The daily build itself is left untouched. The daily build needs neither an embedded patrol scenario nor preconfigured measurement code. By not placing code that anticipates such measurement, the patrol does not break even during development, when the internal structure changes drastically, and we could maintain stability and flexibility. The method is explained in detail below.
2.2. Receive the build completion in CI and start the patrol
When the daily build completes, another workflow subscribes to the build completion trigger and starts the patrol only on success. What is passed to the subsequent workflow at this point is the ID of the run that built the APK.
The started workflow identifies the build artifact from the run ID and downloads it. After that, it launches the LLM agent responsible for the patrol. At the time of writing, the model is Claude Opus 5.5, and effort, which determines the depth of reasoning, is set to medium.
2.3. Unity measurement is performed from inside the app
What this chapter automates is measurement on the Unity side. The purpose is to obtain, in the same form every day, the breakdown inside Unity, such as which assets occupy memory and which Profiler markers are heavy, and to compare them.
There are of course many useful measurement methods that work from outside the device. On iOS, Time Profiler in Instruments can trace bottlenecks at the call stack level. On Android as well, simpleperf and the Android Studio CPU Profiler that uses it can sample down to the level of native functions generated by IL2CPP. Using such tools for automation is quite conceivable, but it is out of scope here.
The Unity breakdown is usually obtained by connecting the Unity Editor's Profiler or Memory Profiler to a physical device. However, putting the Editor into a CI patrol suddenly increases what you have to think about. Every time the project is opened on a runner, you have to wait for the Library folder to import, and each runner needs a Unity license. In addition to the connection between the Editor and the device, you also have to prepare a path such as Unity MCP for operating the Editor from the agent, which complicates the setup.
For this reason, we decided not to use the Editor on CI, use only runtime APIs, and complete the measurement within the application.
2.4. Borrow devices from the device farm
The device farm is STF, a platform that lets you operate physical devices from a browser *1. However, this chapter does not use operation of the device farm through the screen but only securing a device through the API: when you reserve a device, a remote adb endpoint is returned, and the CI runner can handle it in the same way as a USB connection. From reservation to APK installation is combined into one script, which CI calls in a single step.
If the patrol is the only purpose, one free device running Android 10 or later is enough, but if you want to compare measurements from day to day, the comparison is meaningless if the device changes every day. It is better to fix the model for measurement and skip the day if none is free, so that you do not accumulate data that cannot be compared.
2.5. Navigate the screens with in-app remote control
To operate the app, we use a remote control server embedded in the app. When the app starts, it waits for commands only inside the device, and the CI runner connects via adb and sends commands. In addition to fixed commands such as checking whether the app is running, obtaining the object structure on the scene, taking screenshots, and obtaining logs, it can execute arbitrary processing written in JavaScript inside the app.
This JavaScript is interpreted by Jint *2 and can directly touch C# types. Finding a UI button by name and pressing it, reading the current node of the navigation, and starting the measurement SDK can all be done through the same path. It is close to an environment where you can write and try C# code on the spot on a physical device, and you can call the measurement SDK API from outside without rebuilding. You do not need to rebuild the APK each time you change a threshold or the target screen.
To compare measurements every day, you need to go through the same screens in the same order every day. Taps at fixed coordinates shift when the device resolution or layout changes, so we obtain runtime UI objects by name and fire the UI framework's events directly. Which screen the app is currently on is determined by reading the navigation state. If the project has a screen transition graph definition, it can be used as is as input to the patrol plan.
2.6. Upload two kinds: snapshots and captures
For sending measurement data, we use the measurement platform developed in the author's organization. The SDK embedded in the app sends measurement data to a server, which accumulates it and provides day-to-day comparison and alerts on regressions through a dashboard.
The SDK can send more than Unity memory snapshots and Profiler captures. It can also send rendering load such as the CPU time breakdown and the number of draw calls, the processing time of arbitrary sections in code, app startup time, and the transition of memory usage sampled at fixed intervals, so these can also become targets of regular observation if built into the patrol. This chapter focuses on two of them, Table 2.1.
Table 2.1: Measurement data sent by the daily patrol
| Kind | When captured | Prerequisite | How much to send |
|---|---|---|---|
| Memory snapshot | After reaching each screen and it stabilizes | Development Build | One per screen, send all |
| Profiler capture | One per patrol, from start to end | Build with Profiler enabled | Send only frames exceeding thresholds |
2.6.1. Take snapshots for each screen
Memory snapshots use the same format as Unity’s Memory Profiler and, by Unity’s specification, can be taken only in a Development Build*3. The daily build’s patrol APK must be a Development Build, and a build with release settings cannot be reused for measurement.
A snapshot is taken once when the patrol reaches a screen and loading has settled. The name includes the screen name and the commit hash, so that data for the same screen from other days can be lined up later.
2.6.2. Take one capture per patrol and filter it on the device
For a Profiler capture, the SDK reads through the raw Profiler log that Unity writes out, on the device, writes only the frames that match the conditions to a separate file, and uploads it. We do not keep all frames as they are because the Profiler is not suited to long recordings. The Editor's Profiler window can hold at most 2,000 frames, which is a little over 30 seconds at 60 fps. Old frames are discarded first, so even if you connect the Editor and record a patrol of several tens of minutes, only the last 30 seconds or so remain. Writing to a file each time removes the limit on the number of frames, but then the file grows to tens of GB for one patrol. That is too large to keep as a CI artifact or to accumulate every day.
The capture starts at the beginning of the patrol, and stopping and uploading are done together at the end. What is decided at the start is the threshold for which frames to keep, specified by two values: frame time and GC allocation amount. Stopping completes after the unread part of the raw log is consumed. The filtering proceeds in parallel during measurement, so even when writing is fast, as with Deep Profiling, almost no unread data accumulates. Even so, to avoid returning the device before stopping finishes, stopping starts with some margin before the patrol deadline.
2.6.3. Read only the delimiters and match GC by timestamp
The raw log is made by appending per-thread buffers in block units in sequence. To know which block belongs to which frame, you need to find the frame delimiters. The clue is how the Profiler writes. The Profiler switches the thread buffer immediately before and after writing a frame delimiter, so the delimiter arrives as a standalone block of only a dozen or so bytes. The filtering thread therefore opens only blocks no longer than this length and checks whether each is a delimiter. It does not read the contents of longer blocks and treats them as belonging to the current frame of that thread. When the next frame delimiter arrives on the main thread, the frame length is determined, so it decides there whether to keep the frame, and writes out only the blocks of frames to keep, in their original order. Definition blocks that belong to no frame, such as sampler names and thread names, are all written out, so the output can be opened as is in Unity's Profiler window.
The GC allocation amount cannot be obtained from the raw log. The frame statistics in the raw log also have a GC field, but it was 0 in every capture we checked, from Unity 2022.3 to 6000.5. So during measurement, the main thread reads the GC Allocated In Frame counter with ProfilerRecorder every frame. The ProfilerRecorder value carries no timestamp, so within that frame we read ProfilerUnsafeUtility.Timestamp and attach it to the value. This time uses the same clock as the time recorded at the frame delimiters in the raw log. The filtering thread matches the values recorded between the start of one frame and the start of the next as that frame's GC allocation amount. The value for a frame becomes available during the next frame, so the decision waits several frames until the value arrives.
You may wonder whether filtering on the device makes the measurement itself heavier. The filtering runs on a dedicated thread, and the main thread only checks how the data grows and reads the GC counter. As described above, the contents of most blocks are not read, so the processing for filtering is limited to a small part of the data. The filtering thread and the Dispatcher thread that writes out Profiler data are identified by thread name and excluded from the output. The filtering processing is also excluded from Deep Profiling. If it were included, every method call in the filtering thread would become a sample and be written into the very raw log being read. However, the GC counter is a process-wide value, so it includes the several KB per frame that the filtering thread allocates. This is sufficiently small compared with the thresholds described below, but including the load of enabling the Profiler itself, we cannot say the measurement adds no overhead at all.
2.6.4. Decide thresholds by the problem to see and the data volume
In the author's patrol, the thresholds are currently 300 ms and 2 MB. For a 30 fps title, this is about 10 times the usual frame time, and the setting is meant to check whether large stalls during screen transitions and loading have increased since yesterday, not minor hitches during play. With this setting, only a small part of the whole patrol remains as frames, within an amount that can be sent every day. Lowering the thresholds picks up minor hitches too, but more frames remain, the file becomes larger, and it reaches the output limit described below sooner. Adjust the thresholds while watching the data volume, according to the target title's frame rate and the problem you want to solve with measurement.
2.6.5. Fit a long patrol within the device's storage
As the patrol gets longer, where to put the raw log also becomes a problem. The SDK switches the raw log output destination at fixed sizes and splits it into sequentially numbered files, and the filtering thread deletes files it has finished reading. As a result, the device's storage usage plateaus at a few files. If filtering falls behind and too many unprocessed files accumulate, recording is stopped. When switching files, Unity rewrites all definitions of sampler names and object names that have appeared so far at the beginning of the new file. The output is concatenated into one file, so most definitions from the second file onward are duplicates. Definitions that are byte-for-byte identical to the one written immediately before are therefore omitted from the output. The output file has an upper limit of 1.5 GB, and recording stops when the next frame to keep would exceed the limit. Uploads are limited to 2 GB, so stopping before that ensures that the frames kept up to the limit are reliably sent.
Captures also embed a screenshot of each frame. This is because, with Profiler numbers alone, it is hard to tell which screen was displayed and what was shown when a spike occurred. The screen is obtained with asynchronous GPU readback, so the image becomes available several frames later. We therefore re-embed the latest available image at the end of every frame, so that an image is attached whichever frame is kept. From Unity 6.6, the Profiler's built-in feature can also record screenshots continuously, and the feature to take screenshots is enabled by default. However, capture is fixed at once every 15 frames, and the images recorded on the author's Android device were only 256×112 pixels, so UI text was unreadable. Also, on devices where AsyncGPUReadback is not available there is no option, and screenshots were silently disabled. In one day's capture filtered at 300 ms and 2 MB, of the 71 frames that remained, only 6 had a built-in screenshot attached. This is a poor match for filtering that leaves scattered frames, so we continue to use the SDK's own capture.
2.6.6. Attach Metadata to All Data
Besides the metadata attached when uploading a capture, the SDK has a mechanism for attaching information common to all measurement data. If you register the commit hash embedded at build time, the build's run ID, and the device model right after initialization, the same information is attached to both snapshots and captures, and the operating side no longer needs to pass it each time. Measurement results can be ordered by commit because of this registration.
2.7. Also collect shader warmup data through the patrol
The patrol goes through the game's main screens every day, so it also serves as a place to collect data for shader warmup. GraphicsStateCollection is an asset that records the combinations of shader variants and rendering states used during execution so that they can be warmed up in advance from the next time on.
The collection does not use the measurement SDK but calls Unity APIs directly from the remote control. Recording starts at the beginning of the patrol, the patrol goes through the screens as usual, and at the end recording stops and the result is written as a file to the app's storage area on the device. The written file is pulled to the CI runner with adb. It uses neither the Editor nor a Player connection, so, as with measurement, it is completed entirely within CI. However, in IL2CPP builds, code stripping may remove members of unused types, making them uncallable from the remote control. In the build for the patrol, you need to keep the GraphicsStateCollection types with link.xml.
The pulled file is not put into the project as is. Only on days when the patrol finished without stopping on an error and the file was saved, it is merged into the existing asset with the same platform and quality settings, variants that were reported as not found during warmup are removed, and a PR to update the asset is created automatically and merged automatically. In this way, the records of the screens passed through in daily patrols accumulate little by little.
That said, this method alone cannot cover all necessary variants. What is recorded is only the screens the patrol actually went through and what was rendered at that time. Screens the patrol does not pass through, and effects that appear only under specific conditions, are missing from the records. For such omissions, and for pitfalls such as stutters remaining even after warmup, see Part 1, Chapter 6. If you have read this book from the beginning, you may already have read it.
2.8. Delegate everything from regression detection to the fix PR to an agent
Even if data accumulates every day, if nobody opens the dashboard every morning, it ends up merely accumulating. This measurement platform also has a CLI that retrieves data from the command line, and in this chapter's pipeline, everything from confirming a regression to creating a fix PR is delegated to an agent that uses this CLI. Rather than a person writing a request each time, it runs daily as a step following measurement.
When the patrol's measurement finishes, a comparison agent separate from the patrol starts. This agent retrieves today's and the previous day's measurement data with the CLI, compares the spikes remaining in the snapshots and captures of the same screen, and checks whether anything has worsened. If a regression is found, it summarizes which value on which screen changed by how much, the data used for the comparison, and the range of commits made in between, and registers it as an issue in the backlog. If there is no regression, nothing is registered.
The registered issue is picked up by yet another agent, in charge of fixes. It reviews the issue, narrows down the cause from the commit history, applies a fix, and creates a PR. People get involved from the review of that PR.
2.8.1. Verify the fix on a physical device with the same mechanism
Verification of a fix is done separately from the daily patrol. The daily patrol goes through fixed screens in a fixed order and is not suited to matching the screens and conditions that need to be checked for each issue. So a fix verification agent starts when an issue in the backlog moves to the fix completed (awaiting verification) state. This agent uses the same mechanism as the daily patrol, namely a device from the device farm, in-app remote control, and the measurement SDK, runs the build that includes the fix on a physical device, and compares it with the baseline data left in the issue. Only after it confirms on a physical device that the regression is resolved is the ticket handed to QA. Developers do not need to touch a physical device to verify that the fix worked.
This verification mechanism can be used not only for performance regressions but also for everyday bug fixes. As described above, with remote control, processing that can be touched directly, effectively as with reflection, can be executed on the spot, so the agent can operate and read almost everything that happens in the game. If an issue describes reproduction steps and expected results, the agent can follow those steps on a physical device and verify whether the fix works, including the game's internal state.
2.9. Operations to keep it running every day
2.9.1. Division of Roles Between the Patrol Agent and the Measurement Procedure
In this chapter's patrol, a coding agent is given the screen transition graph and how to use the remote control, and performs the patrol. It can work around unreachable screens and rebuild the plan when new screens are added, but the downside is that one patrol takes around 90 turns and costs around 5 dollars. Parts that must be the same every time, such as starting and stopping measurement, are not left to the agent's judgment but fixed as reusable procedures, and the agent only executes them at the specified timing. What the patrol learns is also kept in the repository as a PR for use as input next time.
2.9.2. Handing Over Results
The patrol results are kept as a report, screenshots, logs, and a machine-readable result file, and CI reads the result file and notifies Slack. The measurement results themselves are on the dashboard, so the notification only needs the success or failure of the upload and a link to the dashboard. On days when the comparison finds a regression, the notification to the same channel includes a link to the registered issue. Conversely, on days with no upload, the notification also states that nothing was measured, because measurement silently stopping is the hardest state to notice.
2.10. Future challenges
Because snapshots and captures are taken in the same patrol, the two kinds of data contaminate each other. While a snapshot is being taken, frames stop for several seconds, so it is recorded as a spike in the capture running at the same time. Conversely, during capture, the memory of the Profiler buffer is included in the snapshot, so care is needed when reading the data. If you want to view the data accurately, separating the patrols for snapshots and for captures is also an option, but it roughly doubles the time the device is borrowed, so a compromise such as lowering the frequency is necessary.
The granularity of Profiler captures is also a challenge. Daily measurement turns off Deep Profiling, so game-side scripts are visible only in units such as MonoBehaviour's Update. For places where you want finer detail, you need to add ProfilerMarker manually or enable Deep Profiling. We are therefore exploring methods such as automatically inserting ProfilerMarker into methods of specified assemblies in build-time post-processing. This can be used like a lightweight, targeted Deep Profiling, so we expect to obtain a finer breakdown while keeping the data volume and overhead low.
2.11. Summary
After the daily build, we connected a job that borrows a device from the device farm, runs the game with in-app remote control, and sends memory snapshots and filtered Profiler captures to the measurement SDK. By attaching the commit hash as metadata, measurement results become a per-commit history, and by retrieving them with the CLI, everything from regression detection to issue registration and fix PR creation can be delegated to an AI agent.
The setup in this chapter may look large-scale, but you do not need to prepare everything at once. If you are planning to automate measurement, even just connecting one physical device to a build machine via USB and taking memory snapshots from an interpreter that works through reflection over adb may already serve as a solid regular observation of memory. We hope this chapter helps you take the first step toward measurement automation.
[*1] DeviceFarmer/stf (successor repository to OpenSTF) https://github.com/DeviceFarmer/stf
[*2] sebastienros/jint, JavaScript Interpreter for .NET https://github.com/sebastienros/jint
[*3] Unity Manual, Memory Profiler package https://docs.unity3d.com/Packages/com.unity.memoryprofiler@1.1/manual/index.html